News: A Statistical Analysis of Commercial Aviation Accidents 1958-2020
Source: Airbus Safety First URL: https://safetyfirst.airbus.com/news-a-statistical-analysis-of-commercial-aviation-accidents-1958-2020/ Published: 2021-04-02 Category: Flight Ops, Stats PDF: Original PDF
A Statistical Analysis of Commercial Aviation Accidents
1958 / 2020
01
Airbus
Section titled “Airbus”A Statistical Analysis of Commercial Aviation Accidents 1958-2020
A Statistical Analysis of Commercial Aviation Accidents 1958 / 2020 02
A Statistical Analysis of Commercial Aviation Accidents
1958 / 2020
03
| Contents | Contents | |
|---|---|---|
| List of Graphs | 03 | |
| Scope & Defnitions | 04 | |
| 1 | 2020 & Beyond | 07 |
| Traffc and Accidents in 2020 | 08 | |
| Outlook for 2021 and Beyond | 11 | |
| 2 | Commercial Aviation Accidents 1958-2020 | 13 |
| Evolution of the Number of Flights and Accidents | 14 | |
| Evolution of the Yearly Accident Rate | 15 | |
| Evolution of Commercial Jet Aircraft | 18 | |
| Evolution of Accident Rates by Aircraft Generation | 19 | |
| How Technology Helped Reduce Accidents | 20 | |
| How Technology Addressed the Major Causes of Accidents | 21 | |
| 3 | Commercial Aviation Accidents | |
| Over the Last 20 Years | 23 | |
| Evolution of the Yearly Accident Rate | 24 | |
| Evolution of Accident Rates by Aircraft Generation | 25 | |
| Accidents by Flight Phase | 26 | |
| Accidents by Accident Category | 28 | |
| Evolution of the Main Accident Categories | 29 | |
| Controlled Flight Into Terrain (CFIT) Accident Rates | 30 | |
| Loss Of Control In-fight (LOC-I) Accident Rates | 31 | |
| Runway Excursion (RE) Accident Rates | 32 |
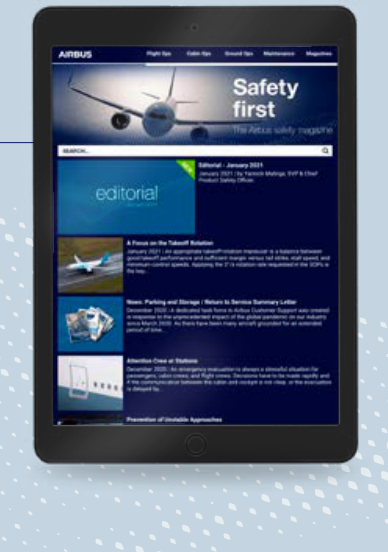
Safety Publications
Section titled “Safety Publications”Safety first
Section titled “Safety first”The Airbus safety magazine
Available in app and website versions
Visit us at safetyfirst.airbus.com
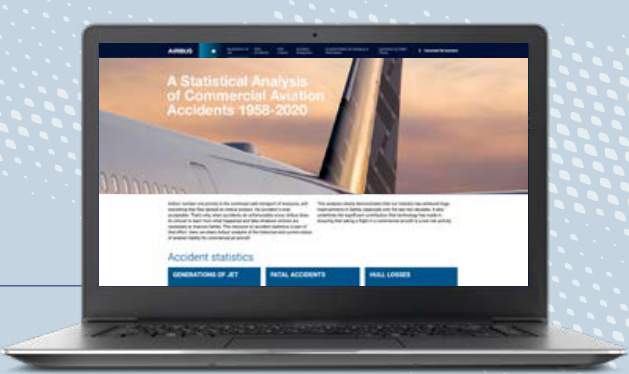
Statistical Analysis of Commercial Aviation Accidents
Also available in website version
Visit us at accidentstats.airbus.com
A Statistical Analysis of Commercial Aviation Accidents
1958 / 2020
03
List of Graphs
Section titled “List of Graphs”| st of Graphs | |
|---|---|
| 2020 & Beyond | 07 |
| World traffc in fight cycles per week | 08 |
| Commercial Aviation Accidents 1958-2020 | 13 |
| Yearly number of fatal accidents 1959-2020 | 14 |
| Yearly number of hull losses 1959-2020 | 14 |
| Yearly fatal accident rate per million fights | 15 |
| Yearly hull loss rate per million fights | 15 |
| Yearly number of fights per aircraft generation (in millions) | 18 |
| 10 year moving average fatal accident rate (per million fights) per aircraft generation | 19 |
| 10 year moving average hull loss rate (per million fights) per aircraft generation | 19 |
| Fatal accident rate (per million fights) per aircraft generation 1958-2020 | 20 |
| Hull loss accident rate (per million fights) per aircraft generation 1958-2020 | 20 |
| Average fatal accident rate (per million fights) per accident category 1958-2020 | 21 |
| Commercial Aviation Accidents Over the Last 20 Years | 23 |
| Yearly fatal accident rate per million fights | 24 |
| Yearly hull loss accident rate per million fights | 24 |
| 10 year moving average fatal accident rate (per million fights) per aircraft generation | 25 |
| 10 year moving average hull loss accident rate (per million fights) per aircraft generation | 25 |
| Accident distribution per fight phase 2001-2020 | 27 |
| Fatal accident distribution per accident category 2001-2020 | 28 |
| Hull loss accident distribution per accident category 2001-2020 | 28 |
| 10 year moving average fatal accident rate (per million fights) per accident category | 29 |
| 10 year moving average hull loss rate (per million fights) per accident category | 29 |
| 10 year moving average CFIT fatal accident rate (per million fights) per aircraft generation | 30 |
| 10 year moving average CFIT hull loss rate (per million fights) per aircraft generation | 30 |
| 10 year moving average LOC-I fatal accident rate (per million fights) per aircraft generation | 31 |
| 10 year moving average LOC-I hull loss accident rate (per million fights) per aircraft generation | 31 |
| 10 year moving average RE fatal accident rate (per million fights) per aircraft generation | 32 |
| 10 year moving average RE hull loss accident rate (per million fights) per aircraft generation | 32 |
A Statistical Analysis of Commercial Aviation Accidents
1958 / 2020
04
Scope & Definitions
Section titled “Scope & Definitions”This publication provides the Airbus annual analysis of aviation accidents, with commentary on the year 2020, as well as a review of the history of the safety record for commercial aviation. This analysis clearly demonstrates that the commercial aviation industry has achieved huge improvements in safety over recent decades. It also underlines the significant contribution that technology has made in ensuring that taking a flight in a commercial jet aircraft is a low-risk activity.
Scope of the Brochure
Section titled “Scope of the Brochure”- All Western-built commercial air transport jets that carry over 40 passengers (including cargo aircraft):
Airbus: A220, A300, A300-600, A310, A318/A319/A320/A321, A330, A340, A350, A380 Boeing: B707, B717, B720, B727, B737, B747, B757, B767, B777, B787 Bombardier CRJ series British Aerospace: Avro RJ series, BAe 146 British Aircraft Corporation BAC-111 Convair 880/990 Dassault Mercure 100 De Havilland Comet Embraer: E170, E175, E190, E195, ERJ 140, ERJ 145, ERJ 145XR Fokker: F28, F70, F100, VFW 614 Hawker Siddeley Trident Lockheed: L-1011 McDonnell Douglas: DC-8, DC-9, DC-10, MD-11, MD-80, MD-90 Sud-Aviation Caravelle Vickers VC-10 Sukhoi Superjet
The goal of any review of aviation accidents is to help the industry further enhance the level of safety, therefore, an analysis of forecasted aviation macro trends is also provided. This highlights the key factors influencing the industry’s consideration of detailed strategies for the further enhancement of aviation safety across the air transport system.
-
Note: Non-Western-built jets are excluded* due to lack of information, and business jets are not considered due to their particular operating environment.
-
*except Sukhoi Superjet
-
Since 1958, the first year with regularly scheduled transatlantic flights using commercial jet aircraft
-
Revenue flights
-
Operational accidents
-
Hull loss and fatal types of accidents
Source of Data
Section titled “Source of Data”-
The accident data was extracted from official accident reports, as well as ICAO, Cirium, and Airbus databases.
-
Flight cycle data was provided by Cirium for all aircraft. Cirium revises these values on an annual basis as further information becomes available from operators.
A Statistical Analysis of Commercial Aviation Accidents
1958 / 2020
05
Definitions
Section titled “Definitions”-
Revenue flight: A flight involving the transport of passengers, cargo or mail. Non revenue flights such as training, ferry, positioning, demonstration, maintenance, acceptance and test flights are excluded.
-
Operational accident: An accident taking place between the time any person boards the aircraft with the intention of flight until the time all such persons have disembarked, excluding sabotage, military actions, terrorism, suicide and the like.
-
Fatal accident: An event in which at least one person is fatally or seriously injured as a result of:
-
being in the aircraft, or
-
direct contact with any part of the aircraft, including parts which have
become detached from the aircraft, or
-
direct exposure to jet blast. This excludes the injuries that are from natural causes, self-inflicted or inflicted by other persons, or when the injuries are to stowaways hiding outside the areas normally accessible by the passengers and crews.
-
Hull loss: An event in which an aircraft is destroyed or damaged beyond economic repair. The threshold of economic repair decreases with the residual value of the aircraft. Therefore, as an aircraft ages, an event leading to damage that was economically repairable years before may be considered a hull loss.
Definition of Accident Categories
Section titled “Definition of Accident Categories”The accident categories described are based on standard ICAO definitions. The seven categories listed below are the accident types that are the cause of most accidents.
Runway Excursion (RE): A lateral veer-off or longitudinal overrun off the runway surface, and not primarily due to SCF or ARC.
-
Loss of Control In-flight (LOC-I): Loss of aircraft control while in flight, and not primarily due to SCF.
-
Controlled Flight Into Terrain (CFIT): In-flight collision with terrain, water, or obstacle without indication of loss of control.
Abnormal Runway Contact
(ARC): Any takeoff or landing involving abnormal runway contact, and not primarily due to SCF, leading to an accident. Hard landings and tail strikes are included in this category.
- Undershoot/Overshoot
(USOS): Touchdown off the runway surface in close proximity to the runway. It includes offside touchdowns.
System/Component Failure or Malfunction (SCF): Failure or malfunction of an aircraft system or component, related to its design, the manufacturing process, or a maintenance issue, and which leads to an accident. SCF includes those related to powerplant (SCF-PP) and those which are not powerplant-related (SCF-NP).
FIRE (F-NI and F-POST): Fire or smoke inside or outside of the aircraft, in flight or on the ground, and regardless of whether the fire results from an impact (F-POST) or not (F-NI).
1
2020 & BEYOND
Section titled “2020 & BEYOND”1.1 TRAFFIC AND ACCIDENTS IN 2020 1.2 OUTLOOK FOR 2021 AND BEYOND
Section titled “1.1 TRAFFIC AND ACCIDENTS IN 2020 1.2 OUTLOOK FOR 2021 AND BEYOND”08 11
A Statistical Analysis of Commercial Aviation Accidents
1958 / 2020
08
2020 was a year when the number of operating aircraft and flights recorded was at its lowest level for over 20 years
Traffic and Accidents in 2020
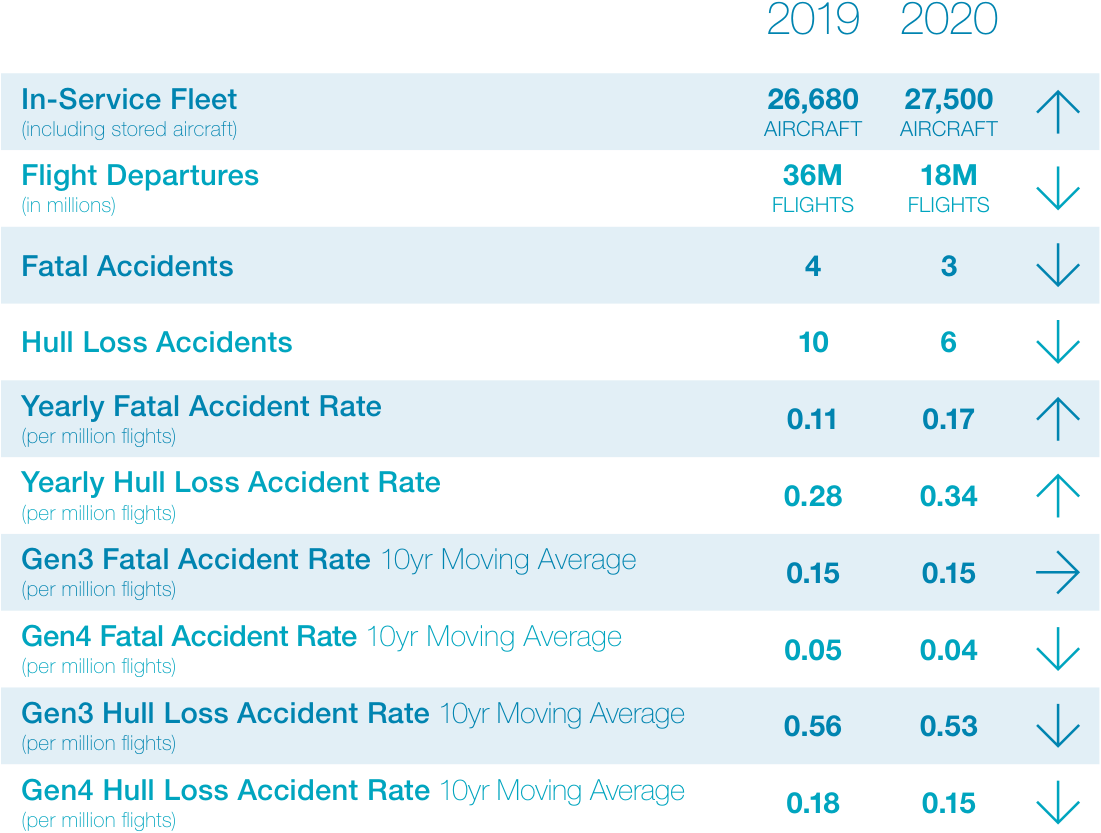
Section titled “Traffic and Accidents in 2020”2020 was a year when the number of operating aircraft and flights recorded was at its lowest level for over 20 years. It is comparable to the year 1998 in terms of capacity. However, there were 3 fatal accidents and 6 hull losses in 2020, compared with the 10 fatal accidents and 24 hull losses in 1998. Even if the number of accidents recorded in a single year is not indicative of the overall level of safety in the commercial aviation industry, this contrast highlights the continual reduction of the accident rate achieved over the last 20 years.
The impact of the Covid-19 pandemic took a noticeable effect from March in 2020 when the number of flights operated globally dropped significantly.
Over the entire year, there were just under 18 million flights recorded for commercial jet aircraft. This is approximately half the number of flights that were operated in 2019. Industry estimates show that up to 60 percent of the global fleet was grounded last year due to the effects of the pandemic on air transport.
World traffic in flight cycles per week
Section titled “World traffic in flight cycles per week”1958 / 2020
09
10
A Statistical Analysis of Commercial Aviation Accidents
1958 / 2020
11
Outlook for 2021 and Beyond
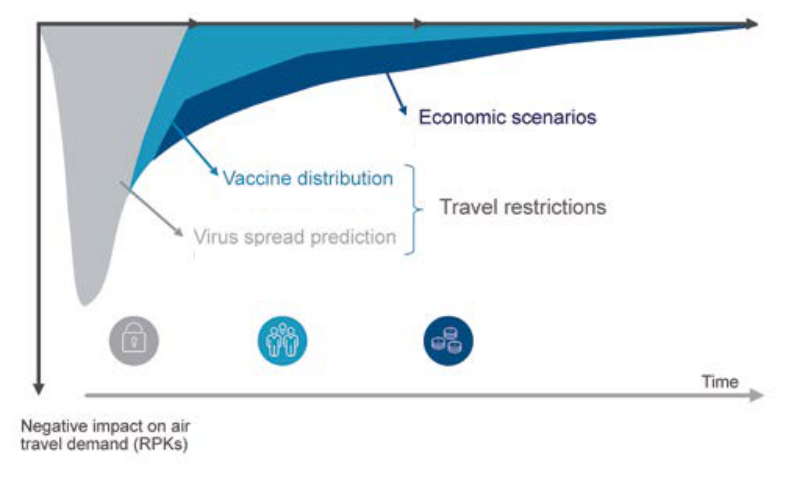
Section titled “Outlook for 2021 and Beyond”Recovery relies on management of the health risks combined with the mindset of travellers and overcoming the economic impacts of the pandemic
Commercial air transport traffic was at its peak in 2019, and was doubling every 15 years. However, the Covid-19 pandemic caused the commercial air transport system in particular to face an unprecedented crisis in 2020. The outlook for 2021 and beyond remains uncertain with the travel restrictions still in place. The trend of commercial air traffic doubling every 15 years will be challenged until the industry recovers to levels seen prior to the pandemic.
Recovery from this crisis relies on management of the health risks combined with the mindset of travellers and overcoming the economic impacts of the pandemic.
Three influencing factors
As soon as travel restrictions are lifted, operators expect to rapidly return their aircraft to service, many of which were grounded and parked at the height of the pandemic.
From a safety perspective, this scenario requires all actors to be focused on the right priorities, which is to ensure safety as aircraft, crews, and passengers return to the skies.
The entire air transport system must adopt a holistic and cooperative approach to continuously enhance the level of safety across the industry in order to protect the future of commercial air travel.
Health risk management Traveller mindset Economic impact
2 COMMERCIAL AVIATION ACCIDENTS 1958-2020
Section titled “2 COMMERCIAL AVIATION ACCIDENTS 1958-2020”2.1 EVOLUTION OF THE NUMBER OF FLIGHTS AND ACCIDENTS 14 2.2 EVOLUTION OF THE YEARLY ACCIDENT RATE 15 2.3 EVOLUTION OF COMMERCIAL JET AIRCRAFT 18 2.4 EVOLUTION OF ACCIDENT RATES BY AIRCRAFT GENERATION 19 2.5 HOW TECHNOLOGY HELPED REDUCE ACCIDENTS 20 2.6 HOW TECHNOLOGY ADDRESSED THE MAJOR CAUSES OF ACCIDENTS 21
Section titled “2.1 EVOLUTION OF THE NUMBER OF FLIGHTS AND ACCIDENTS 14 2.2 EVOLUTION OF THE YEARLY ACCIDENT RATE 15 2.3 EVOLUTION OF COMMERCIAL JET AIRCRAFT 18 2.4 EVOLUTION OF ACCIDENT RATES BY AIRCRAFT GENERATION 19 2.5 HOW TECHNOLOGY HELPED REDUCE ACCIDENTS 20 2.6 HOW TECHNOLOGY ADDRESSED THE MAJOR CAUSES OF ACCIDENTS 21”A Statistical Analysis of Commercial Aviation Accidents
1958 / 2020
14
The number of accidents today is significantly lower than a comparable year more than 20 years ago
The number of flights on commercial jet aircraft was continuously growing prior to the effects of the pandemic. In spite of this growth, the number of accidents was decreasing each decade.
The number of flights in 2020 was less than half of the flights operated in 2019, and there were 3 fatal accidents and 6 hull losses recorded. When compared to a period with an equivalent number of flights, it is in contrast to the 10 fatal accidents and 24 hull losses recorded in 1998.
These figures illustrate the continuous enhancement of safety within the commercial aviation industry over recent decades. However, the number of accidents and flights will vary each year and it is the reason why accident rates are more relevant than reviewing the number of accidents per year when analyzing trends.
Evolution of the Number of Flights and Accidents
Section titled “Evolution of the Number of Flights and Accidents”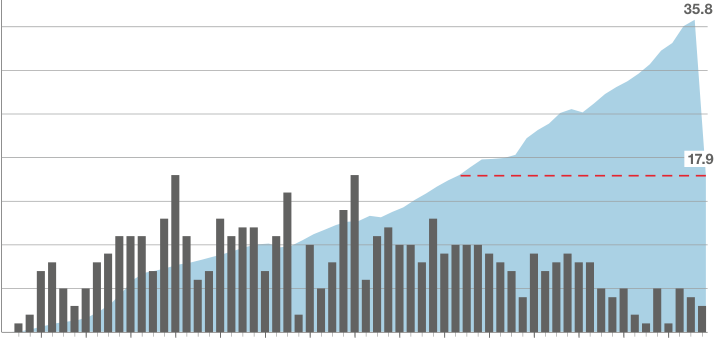
1958 / 2020
15
Evolution of the Yearly Accident Rate
Section titled “Evolution of the Yearly Accident Rate”The rate of fatal accidents and hull losses is steadily decreasing over time
There were far fewer flights in the 1960s, but a peak in the accident rates is shown due to the lower number of flights and the higher number of accidents recorded during this period. It can be difficult to compare accident data from this period with such a low volume of activity in the commercial aviation industry. However, the volume of flights over recent decades is sufficient to show that the accident rate is continually decreasing.
Dials and gauges in cockpit, early autoflight systems Comet, Caravelle, BAC-111, Trident, VC-10, B707, B720, DC-8, Convair 880/990
jet aircraft
Section titled “jet aircraft”A300
From 1964
Section titled “From 1964”More elaborate autopilot and autothrottle systems
Concorde, A300, Mercure, F28, BAe146, VFW 614, B727, B737-100/-200, B747-100/-200/-300/SP, L-1011, DC-9, DC-10
A Statistical Analysis of Commercial Aviation Accidents
1958 / 2020
18
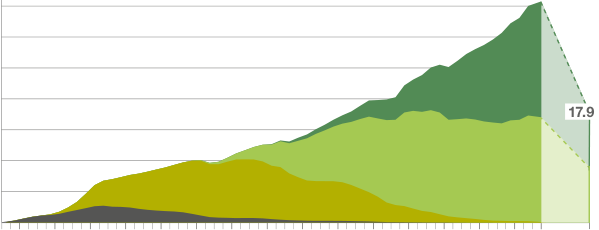
Airbus aircraft flew 76% of the flights made by fourth-generation commercial jet aircraft in 2020
There were less than 18 million flight departures in 2020, due to the effects of the global pandemic, compared with almost 36 million flights the year before. 9 million flights were made by fourthgeneration jets, 7 million of which were Airbus aircraft.
The largest percentage of flights in recent years were made using the latest fourthgeneration commercial jets, which have the lowest accident rate. As the percentage increases over the next decade, this should sustain further decrease in the overall accident rate for commercial air transport.
Evolution of Commercial Jet Aircraft
Section titled “Evolution of Commercial Jet Aircraft”The continual reduction in accident rates shown on the previous pages has been achieved by an ongoing commitment of the commercial aviation industry to enable a safe aircraft to be safely operated in a safe air transport system.
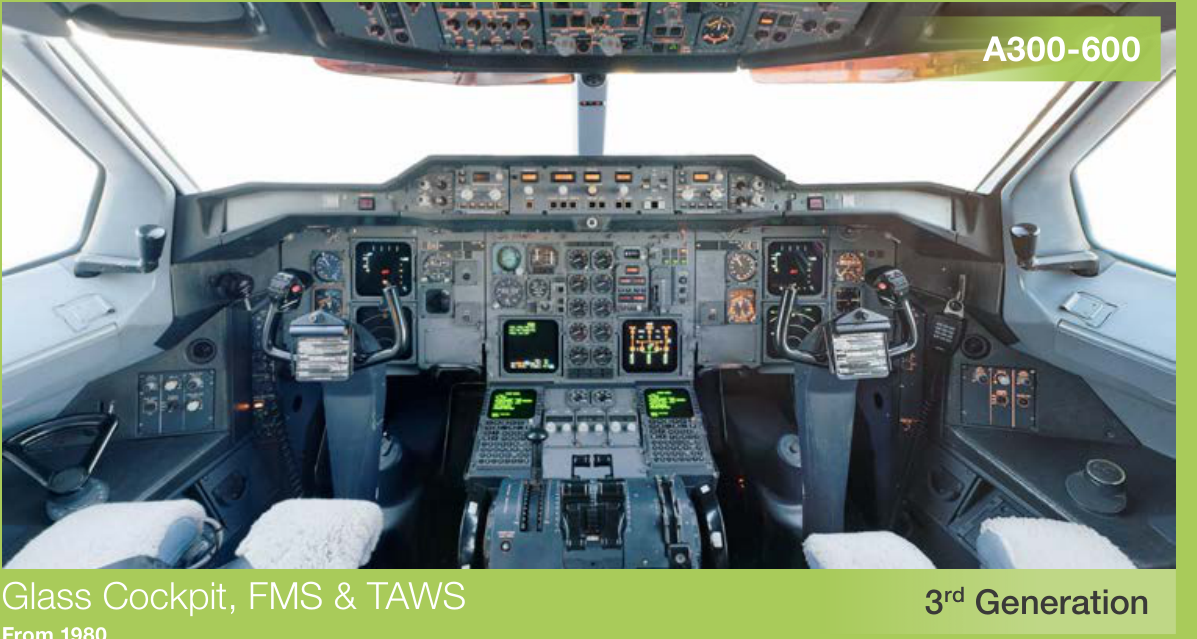
The third generation of aircraft was introduced in the early 1980s. This generation took advantage of digital technologies to introduce glass cockpits with flight management systems and navigation displays, which significantly improved navigation capabilities and position awareness. Combined with the Terrain Awareness and Warning System (TAWS), these evolutions were key to reducing Controlled Flight Into Terrain (CFIT) accidents.
A notable part of this success is due to effective regulation, a strong safety culture, and improvements in training. Technological advances are also a crucial enabler for enhancing the level of safety. In particular, technologies introduced in aircraft systems intentionally evolved with improving safety as their aim.
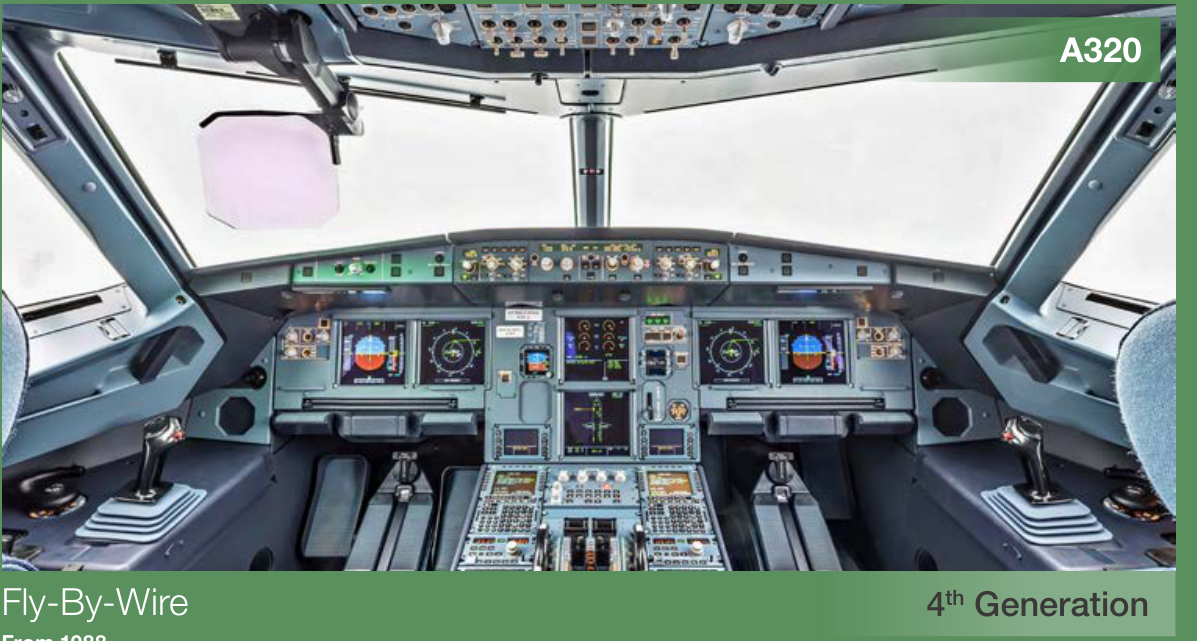
The fourth and latest generation of commercial jet aircraft first entered into service in 1988 with the Airbus A320. Fourth-generation aircraft use fly-by-wire technology with flight envelope protection functions. These functions protect against Loss Of Control In-flight (LOC-I) accidents. Flyby-wire technology is now the industry standard and it is used on every currently produced Airbus model, Boeing B777 and B787, Embraer E-Jets, and the Sukhoi Superjet.
The first generation of commercial jet aircraft were designed in the 1950s and ‘60s with system technologies, which were limited in their capabilities by the analogue electronics of that era. A second generation of aircraft quickly appeared with improved autoflight systems.
Yearly number of flights per aircraft generation (in millions)
1958 / 2020
19
Advances in technology have helped to reduce accident rates for each generation
Calculating the 10 year moving average accident rate provides a clearer picture of an overall trend. The data shows when an aircraft generation has recorded more than 1 million flights in a year and begins from the tenth year after the entry into service of each generation.
For example, the 10 year moving average accident rates for the fourth-generation commercial jet aircraft are shown from 1997, which was the tenth year in service for the A320 aircraft.
The 10 year moving average accident rates for fourth-generation aircraft are around three times lower than the rates recorded for the previous third-generation aircraft.
Evolution of Accident Rates by Aircraft Generation
Section titled “Evolution of Accident Rates by Aircraft Generation”10 year moving average fatal accident rate (per million flights) per aircraft generation
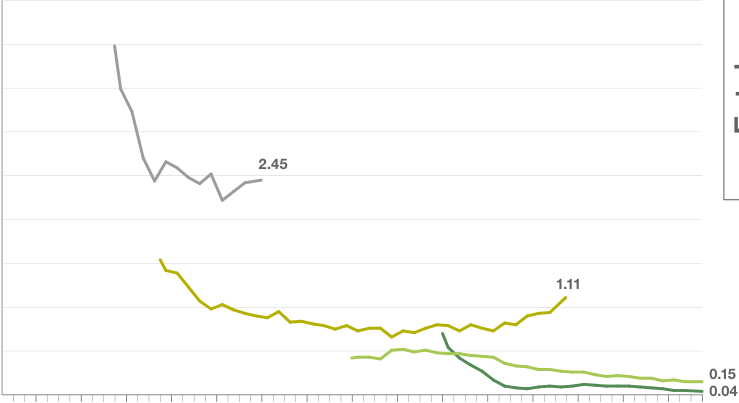
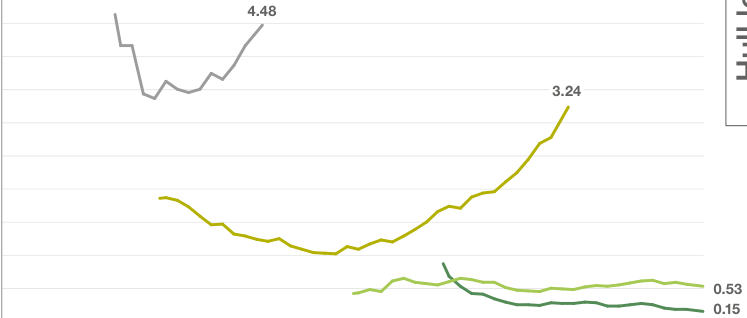
1958 / 2020
20
Statistics over the life of each aircraft generation show a significant improvement in the level of safety, especially since the introduction of third-generation and the latest fourth-generation aircraft
Comparison of accident rates by generation of aircraft provides a clear illustration of the value of commercial aviation industry investments in technology to improve safety.
How Technology Helped Reduce Accidents
Section titled “How Technology Helped Reduce Accidents”Fatal accident rate (per million flights) per aircraft generation 1958-2020
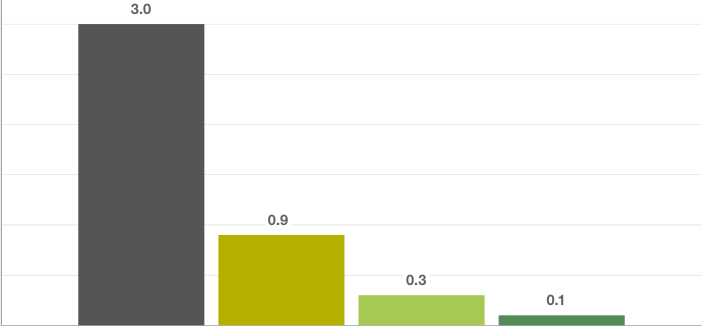
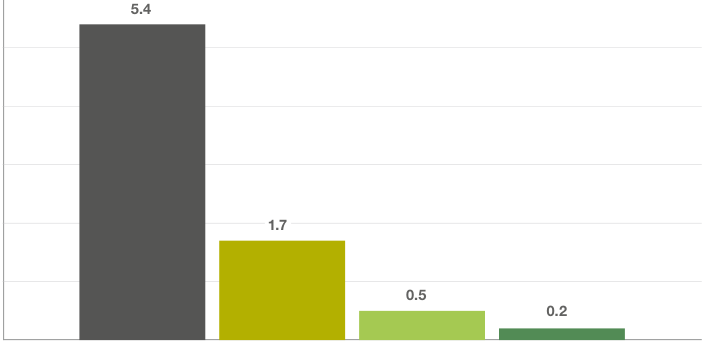
1958 / 2020
21
Accident rates were further reduced with the introduction of new technologies on each generation of aircraft
How Technology Addressed the Major Causes of Accidents
Section titled “How Technology Addressed the Major Causes of Accidents”The benefits of fly-by-wire technologies and energy management systems, which were first introduced on the fourth-generation aircraft, show a lower rate of LOC-I and RE accidents when compared with the previous third-generation aircraft. More detailed analysis about the influence of these technologies on reducing the accident rate is introduced in chapter 3.
The introduction of the Flight Management System (FMS), improved navigation displays, and the Terrain Awareness and Warning System (TAWS) with the third-generation aircraft significantly reduced the number of CFIT fatal accidents when compared to the previous first and second-generation aircraft.
Average fatal accident rate (per million flights) per accident category 1958-2020
| 3.1 | EVOLUTION OF THE YEARLY ACCIDENT RATE | 24 |
|---|---|---|
| 3.2 | EVOLUTION OF ACCIDENT RATES BY AIRCRAFT GENERATION | 25 |
| 3.3 | ACCIDENTS BY FLIGHT PHASE | 26 |
| 3.4 | ACCIDENTS BY ACCIDENT CATEGORY | 28 |
| 3.5 | EVOLUTION OF THE MAIN ACCIDENT CATEGORIES | 29 |
| 3.6 | CONTROLLED FLIGHT INTO TERRAIN (CFIT) ACCIDENT RATES | 30 |
| 3.7 | LOSS OF CONTROL IN-FLIGHT (LOC-I) ACCIDENT RATES | 31 |
| 3.8 | RUNWAY EXCURSION (RE) ACCIDENT RATES | 32 |
A Statistical Analysis of Commercial Aviation Accidents
1958 / 2020
24
A significant reduction in fatal and hull loss accidents was achieved across the commercial aviation industry since 2001
Even with a lower number of accidents compared with 2019, the yearly accident rate in 2020 slightly increased. This is due to a significantly lower number of flights caused by the pandemic, which affects the calculated rate. It shows that the accident rate for a single year is not indicative of the overall safety trend.
Despite the reduction of the yearly accident rate since 2001, the yearly rates of recent years have remained above the lowest figures recorded in 2017. It is a call to action for all actors in the commercial air transport system to be safety vigilant and avoid this becoming an adverse trend.
Evolution of the Yearly Accident Rate
Section titled “Evolution of the Yearly Accident Rate”Yearly fatal accident rate per million flights
Section titled “Yearly fatal accident rate per million flights”1958 / 2020
25
Evolution of Accident Rates by Aircraft Generation
Section titled “Evolution of Accident Rates by Aircraft Generation”Fourth-generation aircraft accident rates are lower than the thirdgeneration rates
10 year moving average fatal accident rate (per million flights) per aircraft generation
Section titled “10 year moving average fatal accident rate (per million flights) per aircraft generation”Fourth-generation aircraft further reduced accident rates by introducing fly-by-wire technology, which made flight envelope protection possible.
The accident rate for the third and fourth generation continued to decrease in 2020. This is indicative of the overall safety trend observed over recent decades.
10 year moving average hull loss accident rate (per million flights) per aircraft generation
1958 / 2020
26
Accidents by Flight Phase
Section titled “Accidents by Flight Phase”Definitions of Flight Phases
Section titled “Definitions of Flight Phases”The flight phases described below are based on standard ICAO definitions:
-
Standing: The phase of flight prior to pushback or taxi, or after arrival, at the gate, ramp, or parking area, while the aircraft is stationary.
-
Taxi: The aircraft is moving under its own power prior to takeoff or after landing. This phase includes the taxi to runway, the taxi to takeoff position and the taxi from runway until the aircraft stops moving under its own power.
-
Takeoff: From the application of takeoff power, through rotation and to an altitude of 35 feet above runway elevation or until gear-up selection, whichever comes first. This phase includes rejected takeoff.
-
Enroute: From completion of initial climb through cruise altitude and completion of controlled descent to the Initial Approach Fix (IAF).
-
Approach: From the IAF to the point of transition from nose-low to nosehigh attitude immediately prior to the flare above the runway.
-
Landing: The phase of flight from the point of transition from nose-low to nose-up attitude, immediately before landing (flare), through touchdown and until the aircraft exits the landing runway or when power is applied for takeoff in the case of a touch-and-go landing, whichever occurs first.
-
Initial climb: From the end of the takeoff phase to the first prescribed power reduction, or until reaching 1000 feet above runway elevation, whichever comes first.
A Statistical Analysis of Commercial Aviation Accidents
1958 / 2020
27
Most of the accidents over the last 20 years occurred during approach and landing phases
All 3 fatal accidents recorded in 2020 occurred in the approach and landing phases.
Approach and landing are highly complex flight phases, which place significant demands on the crew in terms of navigation, aircraft configuration changes, communication with Air Traffic Control, congested airspace, and degraded weather conditions.
This combination of high workload and the increased potential for unanticipated events can create a complex interplay of contributing factors, which may lead to an accident.
A Statistical Analysis of Commercial Aviation Accidents
1958 / 2020
28
Accidents by Accident Category
Section titled “Accidents by Accident Category”The leading cause of fatal accidents over the last 20 years was LOC-I
Fatal accidents distribution per accident category 2001-2020
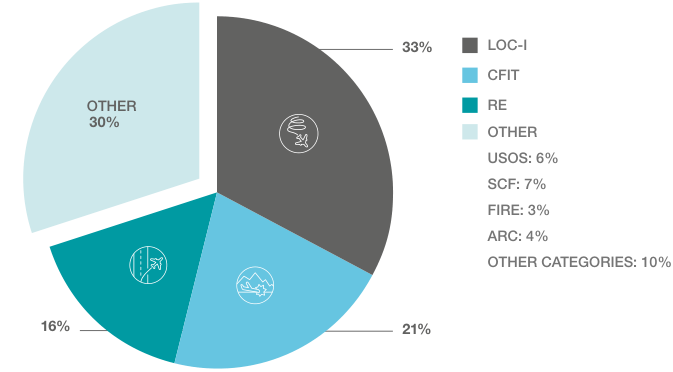
CFIT accidents are the second largest category of accidents. The number of these accidents is decreasing with the continued development of navigation and Terrain Awareness and Warning System (TAWS) technologies, which are available on both third and fourth-generation aircraft.
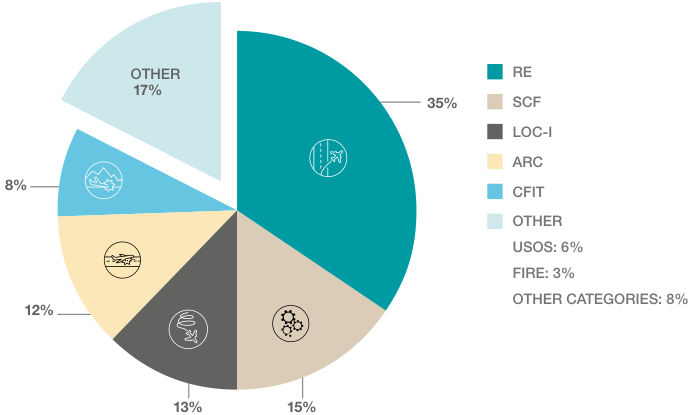
Runway Excursions (RE), including lateral and longitudinal types, are the third major cause of fatal accidents and the primary cause of hull losses. Emerging technologies, both energy-based and performance-based, show promising trends for preventing longitudinal RE accidents.
Hull losses accidents distribution per accident category 2001-2020
1958 / 2020
29
Evolution of the Main Accident Categories
Section titled “Evolution of the Main Accident Categories”Over the last 20 years, the fatal accident rate for CFIT accidents reduced by 89%, and LOC-I by 66%
10 year moving average fatal accident rate (per million flights) per accident category
The proportion of flights flown by aircraft equipped with Flight Management System (FMS) and Terrain Awareness and Warning System (TAWS) technologies, which help to prevent CFIT accidents, has grown from 68% to 99% over the last 20 years.
Over half of all flights in 2020 were made using fourth-generation commercial jet aircraft equipped with fly-by-wire enabled technologies. The rate of LOC-I accidents is 89% lower for fourthgeneration aircraft when compared with third-generation aircraft. As the proportion of flights made using fourthgeneration aircraft continues to grow, the rate of LOC-I accidents is expected to decrease further.
10 year moving average hull loss rate (per million flights) per accident category
A Statistical Analysis of Commercial Aviation Accidents
1958 / 2020
30
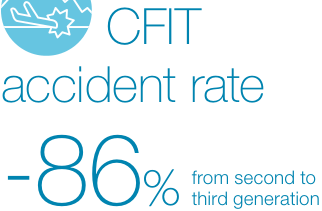
The introduction of glass cockpits, FMS & TAWS has helped to reduce the CFIT fatal accident rate by 86%
Technologies to reduce CFIT were introduced progressively with Terrain Awareness and Warning System (TAWS).
Glass cockpits installed on the third generation of aircraft improved navigation performance due to the introduction of a Flight Management System (FMS) and navigation displays that helped to further reduce the CFIT accident rates.
There were no fatal or hull loss CFIT accidents recorded for fourth-generation aircraft in the last decade. Therefore, the 10 year moving average rate is zero for this generation in 2020.
Controlled Flight Into Terrain (CFIT) Accident Rates
Section titled “Controlled Flight Into Terrain (CFIT) Accident Rates”10 year moving average CFIT fatal accident rate (per million flights) per aircraft generation
1958 / 2020
31
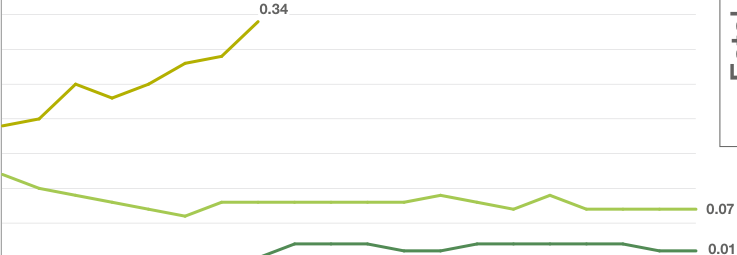
Flight envelope protection has helped reduce LOC-I fatal accident rates by 89%
The fourth-generation aircraft have accumulated over 30 years of in-service experience since the A320 first entered into service in 1988.
This represents more than 210 million accumulated flights by the end of 2020, which is a strong statistical basis illustrating the significant safety benefit of fly-by-wire enabled and flightenvelope-protected aircraft to address LOC-I accidents.
Loss Of Control In-flight (LOC-I) Accident Rates
Section titled “Loss Of Control In-flight (LOC-I) Accident Rates”10 year moving average LOC-I fatal accident rate (per million flights) per aircraft generation
1958 / 2020
32
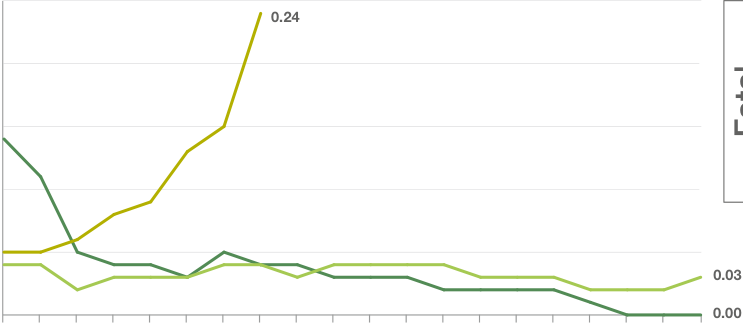
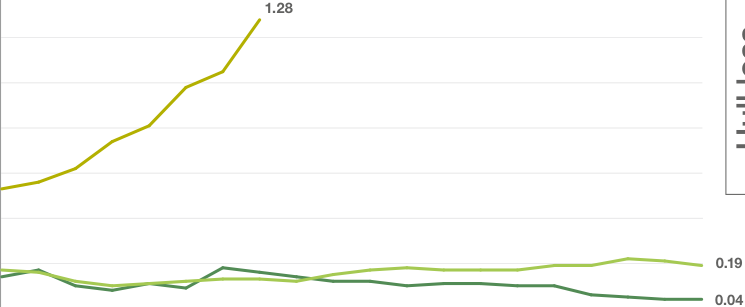
Technologies to reduce RE accidents have been available for over 10 years
Most longitudinal RE accidents are related to aircraft energy management. An improvement of RE accident rates should be expected with the introduction of real-time energy and landing performance-based warning systems, such as the Runway Overrun Protection System (ROPS) available for Airbus aircraft. In 2020, the number of aircraft equipped with ROPS has increased to 8% of the worldwide fleet.
Runway Excursion (RE) Accident Rates
Section titled “Runway Excursion (RE) Accident Rates”10 year moving average RE fatal accident rate (per million flights) per aircraft generation
04
A Statistical Analysis of Commercial Aviation Accidents
AIRBUS S.A.S. 31707 Blagnac Cedex, France © AIRBUS S.A.S. 2021 - All rights reserved, Airbus, its logo and the product names are registered trademarks. Concept design by Airbus MultiMedia Studio 20201626. Photos by Airbus, S. Ramadier, A. Tchaikovski, H. Goussé, P. Chenu, G. Estragnat, J. Vuille. Reference: X00D17008863 Issue 5. March 2021. Printed in France by Art & Caractère. Confidential and proprietary document. This document and all information contained herein is the sole property of AIRBUS S.A.S. No intellectual property rights are granted by the delivery of this document or the disclosure of its content. This document shall not be reproduced or disclosed to a third party without the express written consent of AIRBUS S.A.S. This document and its content shall not be used for any purpose other than that for which it is supplied. The statements made herein do not constitute an offer. They are based on the mentioned assumptions and are expressed in good faith. Where the supporting grounds for these statements are not shown, AIRBUS S.A.S. will be pleased to explain the basis thereof. This brochure is printed on Symbol Tatami White. This paper is produced in factories that are accredited EMAS and certified ISO 9001-14001, PEFC and FSC CoC. It is produced using pulp that has been whitened without either chlorine or acid. The paper is entirely recyclable and is produced from trees grown in sustainable forest resources. The printing inks use organic pigments or minerals. There is no use of basic dyes or dangerous metals from the cadmium, lead, mercury or hexavalent chromium group. The printer, Art & Caractère (France 81500), is engaged in a waste management and recycling programme for all resulting by-products.
来源:Airbus Safety First 网址:https://safetyfirst.airbus.com/news-a-statistical-analysis-of-commercial-aviation-accidents-1958-2020/ 发布日期:2021-04-02 类别:飞行运行、统计数据 PDF:原始 PDF
商业航空事故统计分析
1958 / 2020
01
Airbus
Section titled “Airbus”商业航空事故统计分析 1958-2020
商业航空事故统计分析 1958 / 2020 02
商业航空事故统计分析
1958 / 2020
03
| 目录 | 目录 | |
|---|---|---|
| 图表目录 | 03 | |
| 范围与定义 | 04 | |
| 1 | 2020年及未来 | 07 |
| 2020年交通流量与事故 | 08 | |
| 2021年及未来展望 | 11 | |
| 2 | 1958-2020年商业航空事故 | 13 |
| 飞行架次与事故数量演变 | 14 | |
| 年度事故率演变 | 15 | |
| 商用喷气式飞机演变 | 18 | |
| 按飞机代别划分的事故率演变 | 19 | |
| 技术如何帮助减少事故 | 20 | |
| 技术如何应对事故主要原因 | 21 | |
| 3 | 近20年商业航空事故 | |
| 近20年商业航空事故 | 23 | |
| 年度事故率演变 | 24 | |
| 按飞机代别划分的事故率演变 | 25 | |
| 按飞行阶段划分的事故 | 26 | |
| 按事故类别划分的事故 | 28 | |
| 主要事故类别演变 | 29 | |
| 可控飞行撞地(CFIT)事故率 | 30 | |
| 飞行中失去控制(LOC-I)事故率 | 31 | |
| 冲出跑道(RE)事故率 | 32 |
Safety first
Section titled “Safety first”Airbus 安全杂志
提供应用和网站版本
访问我们的网站:safetyfirst.airbus.com
商业航空事故
统计分析
同样提供网站版本
访问我们的网站:accidentstats.airbus.com
商业航空事故统计分析
1958 / 2020
03
| 图表目录 | |
|---|---|
| 2020年及未来 | 07 |
| 全球每周飞行架次交通量 | 08 |
| 1958-2020年商业航空事故 | 13 |
| 1959-2020年年度致命事故数量 | 14 |
| 1959-2020年年度机体损失数量 | 14 |
| 每百万飞行架次的年度致命事故率 | 15 |
| 每百万飞行架次的年度机体损失率 | 15 |
| 各飞机代别年度飞行架次(百万) | 18 |
| 各飞机代别每百万飞行架次10年移动平均致命事故率 | 19 |
| 各飞机代别每百万飞行架次10年移动平均机体损失率 | 19 |
| 1958-2020年各飞机代别每百万飞行架次致命事故率 | 20 |
| 1958-2020年各飞机代别每百万飞行架次机体损失事故率 | 20 |
| 1958-2020年各事故类别每百万飞行架次平均致命事故率 | 21 |
| 近20年商业航空事故 | 23 |
| 每百万飞行架次年度致命事故率 | 24 |
| 每百万飞行架次年度机体损失事故率 | 24 |
| 各飞机代别每百万飞行架次10年移动平均致命事故率 | 25 |
| 各飞机代别每百万飞行架次10年移动平均机体损失事故率 | 25 |
| 2001-2020年按飞行阶段划分的事故分布 | 27 |
| 2001-2020年按事故类别划分的致命事故分布 | 28 |
| 2001-2020年按事故类别划分的机体损失事故分布 | 28 |
| 各事故类别每百万飞行架次10年移动平均致命事故率 | 29 |
| 各事故类别每百万飞行架次10年移动平均机体损失率 | 29 |
| 各飞机代别每百万飞行架次10年移动平均CFIT致命事故率 | 30 |
| 各飞机代别每百万飞行架次10年移动平均CFIT机体损失率 | 30 |
| 各飞机代别每百万飞行架次10年移动平均LOC-I致命事故率 | 31 |
| 各飞机代别每百万飞行架次10年移动平均LOC-I机体损失事故率 | 31 |
| 各飞机代别每百万飞行架次10年移动平均RE致命事故率 | 32 |
| 各飞机代别每百万飞行架次10年移动平均RE机体损失事故率 | 32 |
商业航空事故统计分析
1958 / 2020
04
本出版物提供空客对航空事故的年度分析,包括对2020年的评论,以及对商业航空安全记录历史的回顾。该分析清楚表明,商业航空业在近几十年中已实现了安全性的巨大提升。它还强调了技术对确保乘坐商业喷气机飞行是一种低风险活动所作出的重大贡献。
本手册的范围
Section titled “本手册的范围”- 所有载客超过40人的西方制造的商用喷气运输机(包括货机):
空客:A220、A300、A300-600、A310、A318/A319/A320/A321、A330、A340、A350、A380 波音:B707、B717、B720、B727、B737、B747、B757、B767、B777、B787 庞巴迪CRJ系列 英国宇航:Avro RJ系列、BAe 146 英国飞机公司BAC-111 康维尔880/990 达索“水星”100 德·哈维兰“彗星” 巴西航空工业:E170、E175、E190、E195、ERJ 140、ERJ 145、ERJ 145XR 福克:F28、F70、F100、VFW 614 霍克·西德利“三叉戟” 洛克希德:L-1011 麦道:DC-8、DC-9、DC-10、MD-11、MD-80、MD-90 南方航空“快帆” 维克斯VC-10 苏霍伊“超级喷气机”
任何航空事故审查的目标都是帮助行业进一步提高安全水平,因此,还提供了对航空宏观趋势的预测分析。这突出了影响行业考虑在整个航空运输系统中进一步提升航空安全详细策略的关键因素。
-
注:由于信息缺乏,非西方制造的喷气机被排除在外*,公务喷气机由于其特殊运行环境而不被考虑。
-
*苏霍伊“超级喷气机”除外
-
自1958年起,首个使用商用喷气机进行定期跨大西洋飞行的年份
-
商业飞行
-
运营事故
-
机体损毁和致命类事故
-
事故数据提取自官方事故报告,以及ICAO、Cirium和空客数据库。
-
飞行循环数据由Cirium为所有飞机提供。Cirium会随着从运营商处获得更多信息的更新而每年修订这些数值。
商业航空事故统计分析
1958 / 2020
05
-
商业飞行:涉及运输乘客、货物或邮件的飞行。非商业飞行,如训练、调机、定位、演示、维护、接收和测试飞行等均被排除。
-
运营事故:发生在任何人登上飞机准备飞行时起至所有此类人员下机时止期间的事故,不包括破坏、军事行动、恐怖主义、自杀及类似事件。
-
致命事故:至少有一人因以下原因死亡或重伤的事件:
-
处于飞机上,或
-
与飞机任何部位直接接触,包括已从飞机上脱落的部件,或
-
直接暴露于发动机喷流中。不包括因自然原因、自伤或他人伤害造成的人员伤害,也不包括藏在乘客和机组人员通常无法进入区域的偷渡者所受的伤害。
-
机体损毁:飞机被摧毁或损坏至无法经济修理的事件。经济修理的阈值随飞机的剩余价值而下降。因此,随着飞机老化,导致损坏的事件可能在数年前还可经济修理,但会被视为机体损毁。
事故类别定义
Section titled “事故类别定义”所述事故类别基于ICAO标准定义。以下列出的七个类别是导致大多数事故的事故类型。
冲出跑道(RE):侧向偏出或纵向冲出跑道表面,主要不是由于SCF或ARC原因。
-
飞行中失去控制(LOC-I):飞行中失去飞机控制,主要不是由于SCF原因。
-
可控飞行撞地(CFIT):与地形、水面或障碍物发生飞行中碰撞,无失控迹象。
异常跑道接触(ARC):涉及异常跑道接触的起飞或着陆,主要不是由于SCF原因,并导致事故。硬着陆和尾触包含在此类别中。
- 未达/超过跑道(USOS):在靠近跑道处冲出跑道表面接地。包括偏出跑道接地的情形。
系统/部件失效或故障(SCF):飞机系统或部件的失效或故障,与其设计、制造过程或维修问题有关,并导致事故。SCF包括与动力装置相关的(SCF-PP)和非动力装置相关的(SCF-NP)。
火灾(F-NI和F-POST):飞机内部或外部在飞行中或地面上的火灾或烟雾,不论火灾是否由撞击引起(F-POST)或非撞击引起(F-NI)。
1
2020年及未来
Section titled “2020年及未来”1.1 2020年航运量与事故 1.2 2021年及未来展望
Section titled “1.1 2020年航运量与事故 1.2 2021年及未来展望”08 11
商用航空事故统计分析
1958 / 2020
08
2020年运营飞机数量和航班数量创20多年来新低
2020年航运量与事故
Section titled “2020年航运量与事故”2020年运营飞机数量和航班数量创20多年来新低。以运力计算,与1998年相当。然而,2020年发生了3起致命事故和6起机体损失,而1998年为10起致命事故和24起机体损失。尽管单年记录的事故数量并不能反映商用航空业整体安全水平,但这一对比凸显了过去20年间事故率的持续下降。
新冠疫情的影响从2020年3月开始显著显现,全球运营航班数量大幅下降。
在整个年度,商用喷气式飞机记录航班数不足1800万架次,约为2019年的一半。行业估计显示,由于疫情对航空运输的影响,去年全球机队有多达60%处于停场状态。
全球每周飞行循环航运量
Section titled “全球每周飞行循环航运量”1958 / 2020
09
10
商用航空事故统计分析
1958 / 2020
11
2021年及未来展望
Section titled “2021年及未来展望”恢复取决于健康风险管理与旅客心态的结合,以及克服疫情经济影响的能力
商用航空运输流量在2019年达到峰值,每15年翻一番。然而,新冠疫情导致商用航空运输系统在2020年面临前所未有的危机。由于旅行限制仍然存在,2021年及未来的前景仍不确定。在行业恢复至疫情前水平之前,商用航空流量每15年翻一番的趋势将受到挑战。
从这场危机中恢复取决于健康风险管理与旅客心态的结合,以及克服疫情经济影响的能力。
三个影响因素
一旦旅行限制解除,运营商预计将迅速恢复飞机运营,其中许多飞机在大流行高峰期间已停飞封存。
从安全角度来看,这一情景要求所有相关方聚焦正确的优先事项,即确保飞机、机组人员和乘客重返天空时的安全。
整个航空运输系统必须采取整体协作的方式,持续提升行业安全水平,以保护商用航空旅行的未来。
健康风险管理 旅客心态 经济影响
2 商用航空事故 1958-2020
Section titled “2 商用航空事故 1958-2020”2.1 航班与事故数量演变 14 2.2 年事故率演变 15 2.3 商用喷气式飞机演变 18 2.4 按飞机代际划分的事故率演变 19 2.5 技术如何帮助减少事故 20 2.6 技术如何应对事故主要原因 21
Section titled “2.1 航班与事故数量演变 14 2.2 年事故率演变 15 2.3 商用喷气式飞机演变 18 2.4 按飞机代际划分的事故率演变 19 2.5 技术如何帮助减少事故 20 2.6 技术如何应对事故主要原因 21”商用航空事故统计分析
1958 / 2020
14
如今的事故数量明显低于20多年前同等运力的一年
在疫情影响之前,商用喷气式飞机航班数量持续增长。尽管如此,事故数量每年都在下降。
2020年航班数量不足2019年的一半,共记录3起致命事故和6起机体损失。与运力相当的时期相比,这与1998年记录的10起致命事故和24起机体损失形成鲜明对比。
这些数据说明了近几十年来商用航空业安全性的持续提升。然而,事故数量和航班数量每年都会有所波动,这正是分析趋势时事故率比逐年事故数量更具参考价值的原因。
航班与事故数量演变
Section titled “航班与事故数量演变”
1958 / 2020
15
年事故率演变
Section titled “年事故率演变”致命事故和机体损失率随时间稳步下降
20世纪60年代航班数量少得多,但由于航班数量较少且该时期记录的事故数量较多,事故率出现峰值。将该时期的事故数据与商用航空业如此低的生产量进行比较可能较为困难。然而,近几十年的航班量足以表明事故率在持续下降。
驾驶舱仪表与表盘,早期自动飞行系统 “彗星”号、“快帆”号、BAC-111、“三叉戟”号、VC-10、B707、B720、DC-8、康维尔880/990
A300
1964年起
Section titled “1964年起”更精密的自动驾驶和自动油门系统
协和式飞机、A300、“水星”号、F28、BAe146、VFW 614、B727、B737-100/-200、B747-100/-200/-300/SP、L-1011、DC-9、DC-10
商用航空事故统计分析
1958 / 2020
18
2020年,空客飞机执行的航班占第四代商用喷气式飞机航班总数的76%
受全球疫情影响,2020年的航班起降次数不足1800万架次,而前一年则接近3600万架次。第四代喷气式飞机执行了900万架次航班,其中空客飞机执飞700万架次。
近年来,最新一代第四代商用喷气式飞机的航班占比最大,其事故率也最低。随着未来十年这一占比的不断提升,商用航空运输的总体事故率有望进一步下降。
商用喷气式飞机的发展演进
Section titled “商用喷气式飞机的发展演进”前文所述事故率的持续下降,得益于商用航空业对以下目标的持续投入:使安全飞机在安全航空运输系统中安全运营。
第三代飞机于20世纪80年代初投入使用。该代飞机利用数字技术引入了配备飞行管理系统和导航显示器的全玻璃座舱,显著提升了导航能力和位置意识。结合地形感知与警告系统(TAWS),这些技术改进对减少可控飞行撞地(CFIT)事故起到了关键作用。
这一成就的重要归因包括有效监管、强有力的安全文化和培训改进。技术进步同样是提升安全水平的关键推动因素。特别是飞机系统中引入的技术,其发展初衷即为提升安全性。
第四代也是最新一代商用喷气式飞机于1988年随空客A320首次投入运营。第四代飞机采用带飞行包线保护功能的电传操纵技术。这些功能可防止飞行中失去控制(LOC-I)事故。电传操纵技术现已为行业标准,并应用于所有当前生产的空客机型、波音B777和B787、巴西航空工业公司E-Jets以及苏霍伊超级喷气机。
第一代商用喷气式飞机于20世纪50年代和60年代设计,当时系统技术受制于那个时代的模拟电子技术能力。第二代飞机随即出现,其自动飞行系统有所改进。
各代飞机年度航班数量(百万架次)
1958 / 2020
19
技术进步有助于降低每一代飞机的事故率
计算10年滚动平均事故率可以更清晰地呈现总体趋势。该数据从每代飞机投入运营的第十年开始统计,前提是该代飞机当年的航班量超过100万架次。
例如,第四代商用喷气式飞机的10年滚动平均事故率从1997年开始显示,这也是A320飞机投入运营的第十年。
第四代飞机的10年滚动平均事故率约为前一代第三代飞机记录的事故率的三分之一。
各代飞机事故率演进
Section titled “各代飞机事故率演进”各代飞机10年滚动平均致命事故率(每百万架次)
1958 / 2020
20
各代飞机的全寿命周期统计数据显示安全水平显著提升,尤其是自第三代飞机和最新第四代飞机投入使用以来
按飞机代别比较事故率,清楚地展示了商用航空业在技术投资以提升安全方面所创造的价值。
技术进步如何降低事故率
Section titled “技术进步如何降低事故率”各代机型每百万飞行架次的致命事故率 1958-2020
1958 / 2020
21
随着各代机型的技术更新,事故率进一步降低
技术如何解决事故主要原因
Section titled “技术如何解决事故主要原因”电传操纵技术和能量管理系统的优势在第四代机型上首次得到应用,与上一代第三代机型相比,LOC-I 和 RE 事故率更低。关于这些技术在降低事故率方面的详细分析将在第3章介绍。
第三代机型引入飞行管理系统 (FMS)、改进的导航显示器以及地形感知与警告系统 (TAWS),与前两代机型相比,CFIT 致命事故数量显著减少。
各类别每百万飞行架次平均致命事故率 1958-2020
| 3.1 | 年度事故率演变 | 24 |
|---|---|---|
| 3.2 | 按机型代别的事故率演变 | 25 |
| 3.3 | 按飞行阶段分类的事故 | 26 |
| 3.4 | 按事故类别分类的事故 | 28 |
| 3.5 | 主要事故类别的演变 | 29 |
| 3.6 | 可控飞行撞地 (CFIT) 事故率 | 30 |
| 3.7 | 飞行中失去控制 (LOC-I) 事故率 | 31 |
| 3.8 | 冲出跑道 (RE) 事故率 | 32 |
商业航空事故统计分析
1958 / 2020
24
2001年以来,整个商业航空行业在致命事故和机体损失事故方面取得了显著减少
尽管2020年事故数量较2019年有所下降,但年度事故率略有上升。这是由于疫情导致航班数量大幅减少,从而影响了计算得出的事故率。这表明单一年份的事故率并不能反映整体安全趋势。
尽管2001年以来年度事故率呈下降趋势,但近几年的年度事故率仍高于2017年创下的最低纪录。这提醒所有商业航空运输体系的参与者必须保持安全警惕,避免这一趋势逆转。
年度事故率演变
Section titled “年度事故率演变”每百万飞行架次年度致命事故率
Section titled “每百万飞行架次年度致命事故率”1958 / 2020
25
按机型代别的事故率演变
Section titled “按机型代别的事故率演变”第四代机型的事故率低于第三代机型
各代机型每百万飞行架次10年移动平均致命事故率
第四代机型通过引入电传操纵技术进一步降低了事故率,使飞行包线保护成为可能。
第三代和第四代机型的事故率在2020年继续下降。这表明近几十年来观察到的整体安全趋势仍在延续。
各代机型每百万飞行架次10年移动平均机体损失事故率
1958 / 2020
26
按飞行阶段分类的事故
Section titled “按飞行阶段分类的事故”飞行阶段定义
Section titled “飞行阶段定义”以下飞行阶段定义基于国际民航组织 (ICAO) 标准定义:
-
停机阶段:推出或滑行前的飞行阶段,或到达登机口、停机坪或停机位后,在飞机静止状态下的阶段。
-
滑行阶段:飞机在起飞前或着陆后依靠自身动力移动的阶段。包括滑行至跑道、滑行至起飞位置以及从跑道滑行至飞机停止移动的整个过程。
-
起飞阶段:从施加起飞推力开始,经抬头至离地高度高于跑道面35英尺,或起落架收起选择生效,两者以先到者为准。此阶段包括中断起飞。
-
航路阶段:从初始爬升完成经巡航高度至受控下降至初始进近定位点 (IAF) 为止。
-
进近阶段:从 IAF 至从机头向下姿态转为机头向上姿态的转换点,即在跑道上拉平之前。
-
降落阶段:从机头向下姿态转为机头向上姿态的转换点,即着陆前拉平开始,经过接地直至飞机脱离着陆跑道,或在连续起降情况下为再次起飞施加推力,两者以先到者为准。
-
初始爬升阶段:从起飞阶段结束至首次规定推力减小,或至高于跑道面1000英尺,两者以先到者为准。
商业航空事故统计分析
1958 / 2020
27
过去20年间,大多数事故发生在进近和降落阶段
2020年记录的全部3起致命事故均发生在进近和降落阶段。
进近和降落是极其复杂的飞行阶段,在导航、飞机形态转换、与空中交通管制的通信、拥挤的空域以及恶劣天气条件等方面对机组提出了极高的要求。
这种高工作负荷与潜在意外事件增加的组合,可能产生复杂的因素相互作用,从而导致事故发生。
商业航空事故统计分析
1958 / 2020
28
按事故类别划分的事故
Section titled “按事故类别划分的事故”在过去20年间,致命事故的首要原因是失控(LOC-I)
2001-2020年各事故类别致命事故分布
可控飞行撞地(CFIT)事故是第二大事故类别。随着导航和地形感知与警告系统(TAWS)技术的持续发展,该类事故数量呈下降趋势,第三代和第四代飞机均已配备该系统。
跑道偏离(RE),包括侧向和纵向类型,是致命事故的第三大原因,也是机体损毁的首要原因。能量基和性能基新兴技术对防止纵向跑道偏离事故显示出良好的趋势。
2001-2020年各事故类别机体损毁事故分布
1958 / 2020
29
主要事故类别演变
Section titled “主要事故类别演变”在过去20年间,CFIT事故致命事故率下降了89%,失控事故下降了66%
各事故类别10年滑动平均致命事故率(每百万飞行次)
配备飞行管理系统(FMS)和地形感知与警告系统(TAWS)技术(有助于防止CFIT事故)的飞机执行的航班比例在过去20年间从68%增长至99%。
2020年,超过一半的航班由配备电传操纵技术的第四代商用喷气式飞机执行。第四代飞机失控事故率与第三代飞机相比低89%。随着使用第四代飞机执行的航班比例持续增长,失控事故率预计将进一步下降。
各事故类别10年滑动平均机体损毁率(每百万飞行次)
商用航空事故统计分析
1958 / 2020
30
玻璃驾驶舱、FMS和TAWS的引入使CFIT致命事故率降低了86%
减少CFIT事故的技术随着地形感知与警告系统(TAWS)的引入而逐步推广。
第三代飞机安装的玻璃驾驶舱通过引入飞行管理系统(FMS)和导航显示器提高了导航性能,进一步降低了CFIT事故率。
在过去十年中,第四代飞机未记录到致命或机体损毁的CFIT事故。因此,2020年该代飞机的10年滑动平均率为零。
可控飞行撞地(CFIT)事故率
Section titled “可控飞行撞地(CFIT)事故率”各代飞机10年滑动平均CFIT致命事故率(每百万飞行次)
1958 / 2020
31
飞行包线保护有助于将失控致命事故率降低89%
第四代飞机自1988年A320首次投入运营以来已累计超过30年的使用经验。
截至2020年底,这些飞机累计飞行超过2.1亿次,这一强有力的统计数据充分说明了电传操纵和飞行包线保护飞机在应对失控事故方面的显著安全效益。
飞行中失去控制(LOC-I)事故率
Section titled “飞行中失去控制(LOC-I)事故率”按飞机代际划分的10年滚动平均LOC-I致命事故率(每百万飞行次)
1958 / 2020
32
减少RE事故的技术已问世超过10年
大多数纵向RE事故与飞机能量管理相关。随着实时能量和基于着陆性能警告系统(如空客飞机配备的跑道冲出保护系统ROPS)的引入,RE事故率的改善值得期待。2020年,配备ROPS的飞机数量已增至全球机队的8%。
跑道偏出(RE)事故率
Section titled “跑道偏出(RE)事故率”按飞机代际划分的10年滚动平均RE致命事故率(每百万飞行次)
04
商业航空事故统计分析
AIRBUS S.A.S. 31707 法国布拉尼亚克,31707 © AIRBUS S.A.S. 2021 - 版权所有,空客、其标识及产品名称均为注册商标。概念设计:空客多媒体工作室 20201626。摄影:空客、S. Ramadier、A. Tchaikovski、H. Goussé、P. Chenu、G. Estragnat、J. Vuille。编号:X00D17008863 第5版。2021年3月。法国印刷:Art & Caractère。本文件为保密专有文件。本文件及其中包含的所有信息均为AIRBUS S.A.S.的专有财产。交付本文件或披露其内容并不构成任何知识产权的授予。未经AIRBUS S.A.S.明确书面同意,不得复制或向第三方披露本文件。本文件及其内容不得用于本文件供应目的以外的任何目的。本文件中的声明不构成要约。这些声明基于所述假设并出于善意表达。如未显示相关支持依据,AIRBUS S.A.S.将乐于解释其基础。本手册印刷用纸为Symbol Tatami White。该纸张在获得EMAS认证并通过ISO 9001-14001、PEFC和FSC CoC认证的工厂生产。纸张使用无氯无酸漂白纸浆,完全可回收,原料来自可持续森林资源。印刷油墨使用有机颜料或矿物质,不使用碱性染料或镉、铅、汞或六价铬组危险金属。印刷商Art & Caractère(法国81500)实施废弃物管理和所有副产品的回收计划。