Control your Speed... During Descent, Approach and Landing
Source: Airbus Safety First URL: https://safetyfirst.airbus.com/control-your-speed-during-descent-approach-and-landing/ Published: 2017-07-29 Magazine Issue: 2017-08 Category: Flight Ops, AFS, approach, CDA, deceleration, DES, descent, ECON, energy, excursion, FMS, fpa, ground speed mini, GS, landing, managed, mmo, overrun, overspeed, perf, runway excursion, selected, speed, stabilization, Unstabilized, v/dev, vapp, vfe, vls, vmo PDF: Original PDF
PROCEDURES
Section titled “PROCEDURES”Control your Speed… During Descent, Approach and Landing
Control your Speed… During Descent, Approach and Landing
Section titled “Control your Speed… During Descent, Approach and Landing”This article is the conclusion of our theme of speed management during a flight, which began in Safety first Issue #18. We are entering into the descent phase. Our objective is to cover descent from cruise altitude down toward the destination airport and prepare the aircraft for its approach and landing.
This article aims to highlight how the reference, limit and operating speeds are useful during descent, approach and landing. It also provides a description of the tools that are available and operational recommendations on how to manage the aircraft energy during the last phases of flight.
Energy management, and as a consequence speed management, is critical during descent, approach and landing phases. An aircraft fl ying at cruise altitude, and at its cruise speed, has a lot of energy to dissipate before reaching its destination airport and to land with an appropriate speed. Incorrect management of the speed in descent can result in excess-energy in fi nal approach phase. This is shown to be a major cause of runway overrun events.
MANAGING YOUR DESCENT, APPROACH AND LANDING: UNDERSTAND SPEEDS
Section titled “MANAGING YOUR DESCENT, APPROACH AND LANDING: UNDERSTAND SPEEDS”Maneuvering speeds
Section titled “Maneuvering speeds”Green dot is the managed speed target in CONF CLEAN when the FMS approach phase is activated.
As for the previous fl ight phases, Green Dot, S and F speeds guide the fl ight crew during descent and approach phases.
Green Dot (GD) speed
Section titled “Green Dot (GD) speed”Defi nition
Section titled “Defi nition”GD speed (fi g.1) is the engine-out operating speed in clean confi guration. It provides an estimate of the speed for best lift-to-drag ratio.
GD speed is the managed speed target in CONF CLEAN when the FMS approach phase is activated. It is also the recommended speed to extend fl aps to CONF 1 and for a holding in clean confi guration.
How is GD speed determined?
Section titled “How is GD speed determined?”The Auto Flight System (AFS) computes GD speed using the aircraft weight, based on the Zero Fuel Weight (ZFW) entered in the FMS during fl ight preparation, and the pressure altitude. The GD formula has been set up so that the resulting airspeed provides the best lift-to-drag ratio for a given altitude and aircraft weight, in clean confi guration with one engine out.
In some phases of fl ight, GD is computed to minimize drag and thus, the fuel consumption (for example during the HOLD phase).
Control your Speed… During Descent, Approach and Landing
PROCEDURES
Section titled “PROCEDURES”S and F speeds
Section titled “S and F speeds”Defi nition
Section titled “Defi nition”S speed:
Section titled “S speed:”In approach phase, S speed is the managed speed target, when in CONF 1 or 1+F. It is the recommended speed to select CONF 2.
It is displayed as a green ‘‘S’’ on the PFD airspeed scale (fi g. 2) and shown only when the Slats/Flaps control lever is on position 1 (CONF 1 or 1+F).
F speed:
Section titled “F speed:”In approach phase, F speed is the managed speed target, when in CONF 2 or 3. It is the recommended speed to select CONF 3 when in CONF 2, and to select CONF FULL when in CONF 3.
It is displayed as a green ‘‘F’’ on the PFD airspeed scale (fi g. 3) and shown only when the Slats/Flaps control lever is in CONF 2 or 3 during the approach phase and go-around.
How are S and F speeds determined?
Section titled “How are S and F speeds determined?”S and F speeds are obtained using the Stall speed of the corresponding confi guration (Vs1g) demonstrated during fl ight tests multiplied by a specifi c factor depending on the aircraft type. Margins are kept with the Minimum Control speed at Landing (VMCL) determined during fl ight tests, and with the maximum speed with Flaps Extended of the next confi guration (VFE NEXT):
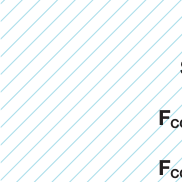
S or F = VS1G x factor
Section titled “S or F = VS1G x factor”S = k x VS1G CLEAN with 1.21 ≤ k ≤ 1.23
FCONF2 = k x VS1G CONF 2 with 1.38 ≤ k ≤ 1.47
FCONF3 = k x VS1G CONF 3 with 1.32 ≤ k ≤ 1.36
F speed on the PFD speed scale
Limit Speeds
Section titled “Limit Speeds”During descent, approach and landing, the operation of the aircraft is also framed within limit speeds. Their indication on the PFD or on a placard enables the fl ight crew to easily identify the aircraft speed envelope.
VMAX: Maximum speed
Section titled “VMAX: Maximum speed”Defi nition
Section titled “Defi nition”VMAX is the maximum speed defi ning the aircraft’s fl ight envelope. VMAX is equal to:
-
VMO/MMO in clean confi guration with landing gears up.
-
VFE in high lift confi gurations with landing gears up.
-
VLE/MLE in clean confi guration with landing gears down.
-
The minimum of VFE and VLE/MLE in high lift confi gurations with landing gears down.
On the PFD airspeed scale, it corresponds to the lower end of the red and black strip (fi g.4).
VMO/MMO: Maximum Operating speed/Mach number
Section titled “VMO/MMO: Maximum Operating speed/Mach number”Defi nition
Section titled “Defi nition”In CONF CLEAN, VMO/MMO is the higher limit of the aircraft speed envelope.
How is VMO /MMO determined?
Section titled “How is VMO /MMO determined?”VMO/MMO is derived from the design limit Mach/speed VD/MD by applying a margin related to aircraft dive characteristics. For more details on VMO /MMO determination, refer to the Safety fi rst issue 21 dated January 2016.
VFE: maximum speed with the Slats/Flaps extended
Section titled “VFE: maximum speed with the Slats/Flaps extended”Defi nition
Section titled “Defi nition”VFE is the maximum speed with the slats or fl aps extended.
There is one VFE per confi guration.
The VFE is displayed on the airspeed scale of the PFD as the VMAX (fi g. 5) when the Slats/Flaps are extended, based either on the Slats/Flaps lever position or the actual Slats/Flaps position.
|---|---|---|---| |||||
(fi g.6)
Section titled “(fi g.6)”Table showing source of information for V display on PFD
- A340-200/300.
The VFE of each Slats/Flaps confi guration is also available on the speeds placard in the cockpit.
How is VFE determined?
Section titled “How is VFE determined?”The VFE is based on the structural limit speed of the Slats/Flaps confi guration plus a margin. It is a fi xed value associated to the aircraft model.
VFE NEXT
Section titled “VFE NEXT”Defi nition
Section titled “Defi nition”The aim of the VFE NEXT is to remind the fl ight crew the maximum speed at which they can extend the next Slats/Flaps confi guration during approach.
VFE NEXT is displayed on the airspeed scale of the PFD (fi g. 7).
VFE NEXT is displayed in fl ight, below FL200 (FL220 on A350).
How is VFE determined?
Section titled “How is VFE determined?”VFE NEXT is the VFE of the next Slats/Flaps confi guration.
Control your Speed… During Descent, Approach and Landing
PROCEDURES
Section titled “PROCEDURES”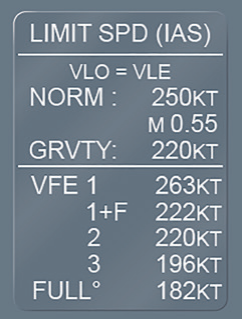
(fi g.8) Example of speed placard on the A380
VLE /MLE: Landing gear Extended speed/Mach
Section titled “VLE /MLE: Landing gear Extended speed/Mach”Defi nition
Section titled “Defi nition”VLE/MLE is the maximum speed/Mach at which the aircraft can fl y with the landing gear extended.
VLE /MLE is displayed on the airspeed scale of the PFD as the VMAX when the landing gear is extended as long as VLE /MLE is lower than VFE. It is also available on the speeds placard in the cockpit (fi g. 8).
How is VLE determined?
Section titled “How is VLE determined?”VLE is determined to provide suffi cient fl ight domain with landing gear extended, taking into account the structural limitation of the landing gear and landing gear doors.
VLO /MLO: Landing gear Operating speed/Mach
Section titled “VLO /MLO: Landing gear Operating speed/Mach”Defi nition
Section titled “Defi nition”VLO /MLO is the maximum speed/Mach to operate (both extend and retract) the landing gear.
VLO /MLO is not displayed on the PFD; it is available on the speeds placard in the cockpit (fi g. 8).
How is VLO /MLO determined?
Section titled “How is VLO /MLO determined?”Since
Speedbrakes extension increases Vs1g, V increases when LS the speedbrakes are extended.
VLO/MLO is determined to provide sufficient flight domain for landing gear extension/retraction, taking into account the structural limitation of the landing gear and landing gear doors.
VLS: Lowest Selectable Speed
Section titled “VLS: Lowest Selectable Speed”Defi nition
Section titled “Defi nition”VLS is the lowest selectable speed for the autopilot and the autothrust. Even if the selected target speed is below VLS, the A/THR will maintain VLS as a minimum. VLS is indicated by the top of the amber strip on the PFD airspeed scale (fi g. 9).
VLS (of selected landing confi guration: CONF 3 or FULL), is also displayed on the FMS APPR page.
For descent and approach fl ight phases, VLS of Fly-By-Wire aircraft is obtained using the Stall speed demonstrated during fl ight tests (VS1G) of the corresponding confi guration, multiplied by a factor of 1.23. On A320 family aircraft, the factor may be increased for some Slats/Flaps confi gurations for manoeuvrability improvement and/or to increase margins with protection speeds. VLS is always greater or equal to the Minimum Control Speed at Landing (VMCL).
A320 family: VLS = k x VS1G with 1.23 ≤ k ≤1.28
Section titled “A320 family: VLS = k x VS1G with 1.23 ≤ k ≤1.28”VLS ≥ VMCL
Section titled “VLS ≥ VMCL”Since Speedbrakes extension increases Vs1g, VLS increases when the speedbrakes are extended.
Operating Speeds
Section titled “Operating Speeds”ECON DES speed/Mach
Section titled “ECON DES speed/Mach”Defi nition
Section titled “Defi nition”ECON DES speed/Mach is the optimum descent speed/Mach to lower the direct operating costs of the descent. How is ECON DES speed/Mach determined? ECON DES speed/Mach is computed by the FMS based on the Cost Index (CI), cruise FL and on the aircraft weight. VAPP: Approach speed Defi nition
ECON DES speed/Mach is the optimum descent speed/Mach to lower the direct operating costs of the descent.
VAPP is the fi nal approach speed when the Slats/Flaps are in landing confi guration and the landing gears are extended. VAPP is displayed in the FMS PERF APPROACH page. How is VAPP determined? The VAPP can be computed by the AFS or inserted manually by the pilot through the FMS PERF Page.
VAPP is based on the VLS of the landing confi guration. For Airbus aircraft, in normal operations, the VAPP is defi ned by:
VAPP = VLS Landing CONF + APPR COR AFS Computation of VAPP
Section titled “VAPP = VLS Landing CONF + APPR COR AFS Computation of VAPP”When computed by the AFS, the APPRoach CORrection (APPR COR) used by the AFS is APPR COR = 1/3 Headwind with 5kt ≤ APPR COR ≤15 kt Excepted on some older A320 aircraft where the APPR COR used by the AFS is 1/3 Headwind + 5kt, limited at 15kt.
VAPP Computation by the Flight Crew The fl ight crew can chose to insert any VAPP by computing its own APPR CORR as follows:
APPR COR = highest of: • 5kt if A/THR is ON • 5kt if ice accretion (10kt instead of 5kt on A320 family when in CONF 3) • 1/3 Headwind excluding gust • Flight crew speed increment (*) (*) In some situations (e.g. gusty conditions or strong crosswind), the fl ight crew may choose a higher V than the AFS computation as good with APPR COR ≤15 kt airmanship.
During autoland or when A/THR is ON or in case of ice accretion or gusty crosswind greater than 20kt, VAPP must not be lower than VLS + 5kt.
Control your Speed… During Descent, Approach and Landing
PROCEDURES
Section titled “PROCEDURES”VAPP in the case of a system failure
Section titled “VAPP in the case of a system failure”In the case of a system failure during fl ight, the fl ight crew computes a new VAPP value:
With VREF = VLS CONF FULL
Section titled “With VREF = VLS CONF FULL”∆VREF is the speed increment related to the failure to counter associated handling qualities issues and/or increased stall speed.
APPR COR depends on the ∆VREF, the ice accretion, the headwind value and the use of autothrust.
For more information on the determination of VAPP with failure by the fl ight crew, refer to the Flight Crew Techniques Manual (FCTM).

The FMS can compute an accurate and optimized descent profi le, provided the descent winds have been entered in the FMS during the descent preparation, and provided the PERF and IDLE factors are tuned according to the actual aircraft performance.
MANAGING SPEED DURING DESCENT
Section titled “MANAGING SPEED DURING DESCENT”The descent profi le computed by the Flight Management System (FMS) is a very effi cient and useful tool to help the fl ight crew in managing the aircraft energy during the descent and approach phases.
Descent Profi le Computation
Section titled “Descent Profi le Computation”The FMS can compute an accurate and optimized descent profi le, provided the descent winds have been entered in the FMS during the descent preparation, and provided the PERF and IDLE factors are tuned according to the actual aircraft performance.
To locate the Top of Descent (T/D), the FMS computes the descent profi le backwards from the Missed Approach Point (MAP) , assuming the aircraft is stabilized at its VAPP 1000ft above the runway elevation, up to the T/D.
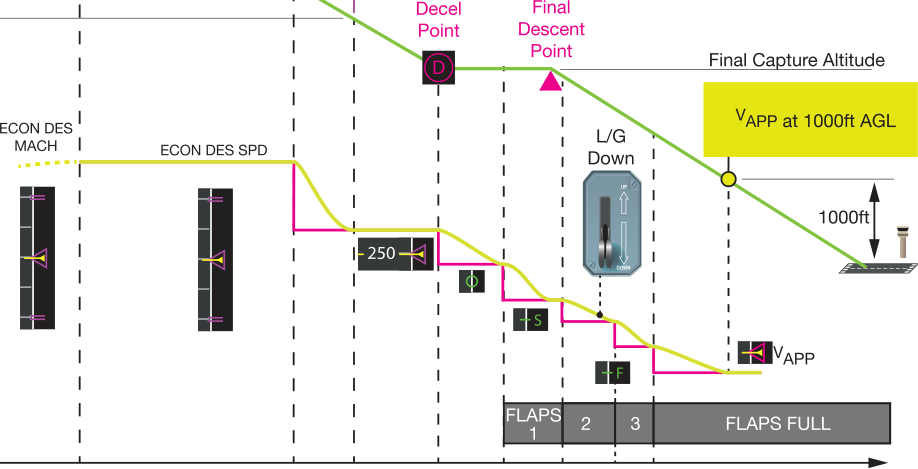
The FMS assumes the use of managed speed and accounts for all the speeds and altitude constraints coded on the FMS fl ight plan. Refer to (fi g.10).
During the descent, approach and landing the managed speed is equal to either:
-
ECON DES speed or the descent speed manually entered in the PERF DES page of the FMS, or
-
The speed constraint, or
-
The manoeuvring speed of the current aircraft confi guration, or
-
VAPP.
(fi g.10)
Section titled “(fi g.10)”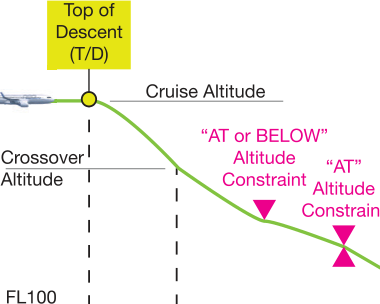
Typical managed descent profi le (without Continuous Descent Approach (CDA) function)
PROCEDURES
Section titled “PROCEDURES”Control your Speed… During Descent, Approach and Landing
IMPACT OF THE WIND ON THE DESCENT PATH
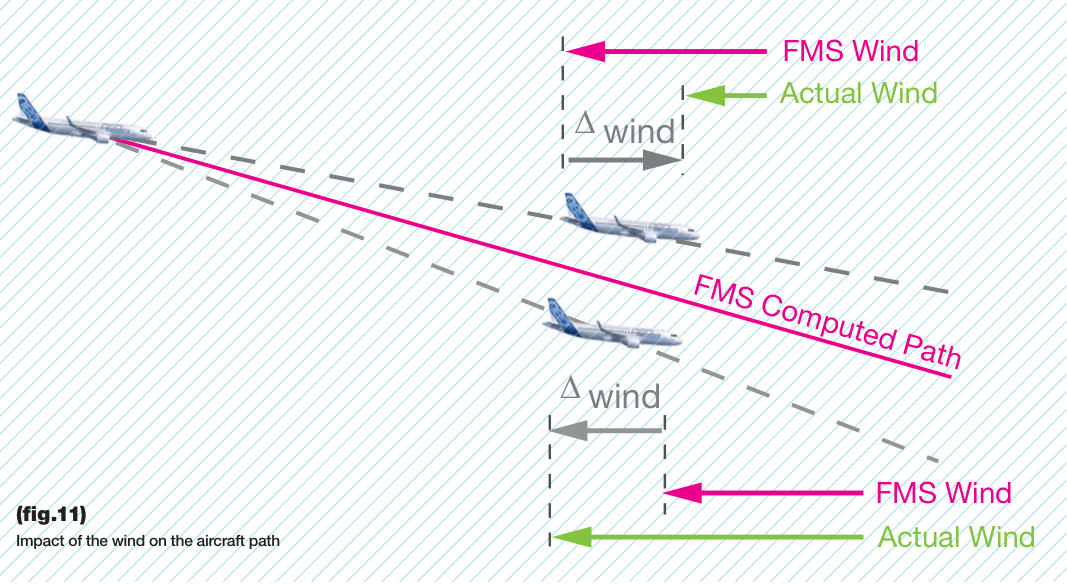
Section titled “IMPACT OF THE WIND ON THE DESCENT PATH”The descent path computed by the FMS uses the forecasted wind entered in the DESCENT WIND page. However, in fl ight, actual conditions may vary from the predicted ones. As a consequence, the difference
between the predicted descent wind and the actual wind (∆wind) affects the aircraft’s behavior. If the speed target is maintained (as in OP DES mode), the aircraft tends to leave the FMS computed idle path (fi g.11).
Managed Descent (DES)
Section titled “Managed Descent (DES)”The managed descent mode guides the aircraft along the FMS computed vertical fl ight path. The DES mode is preferred when conditions permit since it ensures the management of altitude constraints and reduces the operating cost when fl ying at ECON DES speed.
The DES mode is only available when the aircraft fl ies on the FMS lateral fl ight plan, i.e. when the aircraft uses the NAV horizontal guidance mode.
(fi g.12)
Section titled “(fi g.12)”Speed range principle during the idle segment of a managed descent.
∆ wind (FMS wind vs Actual wind)
Section titled “∆ wind (FMS wind vs Actual wind)”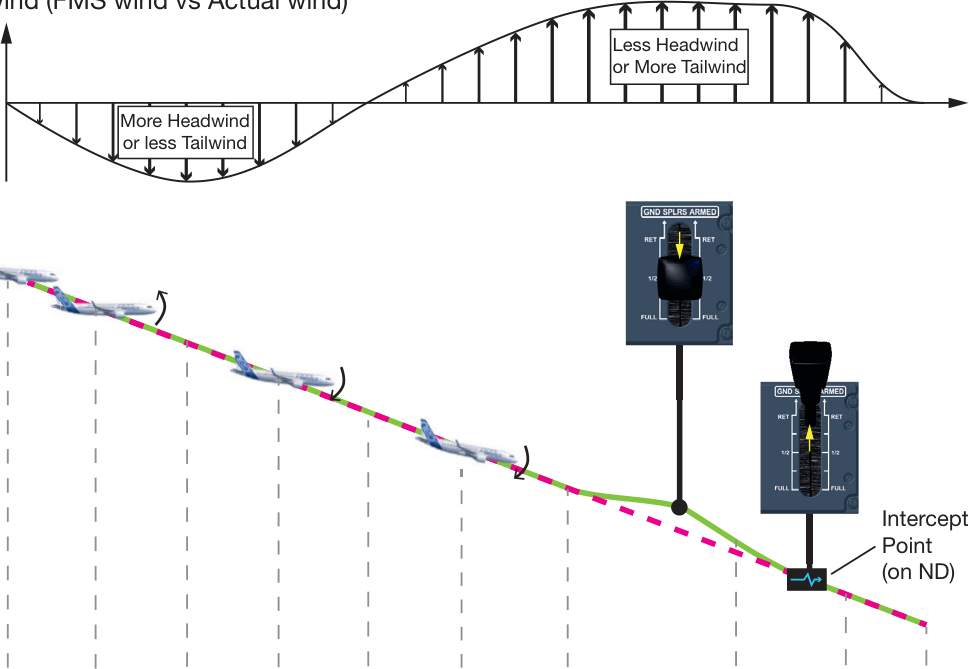
In DES mode with managed speed the elevators adjust the pitch to enable the aircraft to stay on the computed path and the A/THR commands idle thrust.
The AFS allows the aircraft speed to vary in a range of +/- 20 knots around the managed speed target (+5 kt or -20 kt in the case of a speed constraint), limited to VMAX -5kt to stay on path:
-
If the speed decreases down to its lower limit, the A/THR will increase the thrust
-
If the speed reaches its upper limit, the aircraft will leave the path to maintain the upper limit speed.
Control your Speed… During Descent, Approach and Landing
PROCEDURES
Section titled “PROCEDURES”On geometric segment
Section titled “On geometric segment”On the geometric segment, the A/THR adapts thrust to maintain the managed speed target.
Use of speedbrakes in DES mode
Section titled “Use of speedbrakes in DES mode”The use of speedbrakes in DES mode must be limited to the situation where there is either a strong tailwind or much less tailwind than expected, and the aircraft diverges from the profi le. The fl ight crew should increase drag by extending the speed brakes (fi g.12).
As a visual clue the ND displays the intercept point at which the aircraft will reach the profi le with half speed brakes extended. If the fl ight crew does not extend the speed brakes the interception point will continuously move forward along the fl ight plan. If the interception point gets closer to an altitude constraint, a ‘‘MORE DRAG’’ or EXTEND SPD BRK’’ message is displayed on the FMA and on the MCDU scratchpad/MFD.
Note: The speed range does not apply below FL 100 for A350 and A330 equipped with HONEYWELL P5 FMS 2 release 2. In this case, the aircraft stays on the path and the fl ight crew must monitor the speed and use speedbrakes when appropriate.
In OP DES mode, the A/THR commands idle thrust and the elevators adjust the pitch to maintain the target speed.
Selected Descent (OP DES and V/S)
Section titled “Selected Descent (OP DES and V/S)”In OP DES mode, the AFS commands idle thrust and the elevators adjust the pitch to maintain the target speed (managed or selected).
(fi g.13)
Section titled “(fi g.13)”Adjustment of the selected speed to modify the descent path.
The OP DES mode can be used to increase or reduce the descent slope. In OP DES, the fl ight crew adjusts the target speed to modify the descent path (fi g.13).
Selected Speed Increase = Descent Slope Increase
The flight crew can use the V/S mode during descent to get accurate guidance to recover the intended flight path by adjusting the V/S using the V/S selector.
In V/S mode, the AFS adjusts pitch and thrust to maintain the selected vertical speed and the target speed.
Tools for Energy Management during Descent
Section titled “Tools for Energy Management during Descent”V/DEV Indication
Section titled “V/DEV Indication”When in NAV lateral mode, the flight crew uses the ‘‘yoyo’’ indication to estimate its position relative to the FMS computed path. The Vertical deviation (V/DEV) value is provided on the FMS PROG page (A320/A330/A340) (fig.14) or PERF DES page (A380/A350).
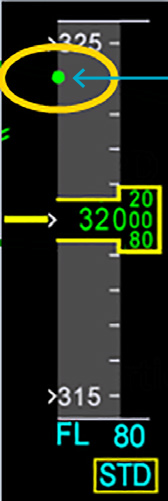
(fig.14)
Section titled “(fig.14)”example of V/DEV indication on the PFD and on the FMS PROG page (A320)
Energy Circle
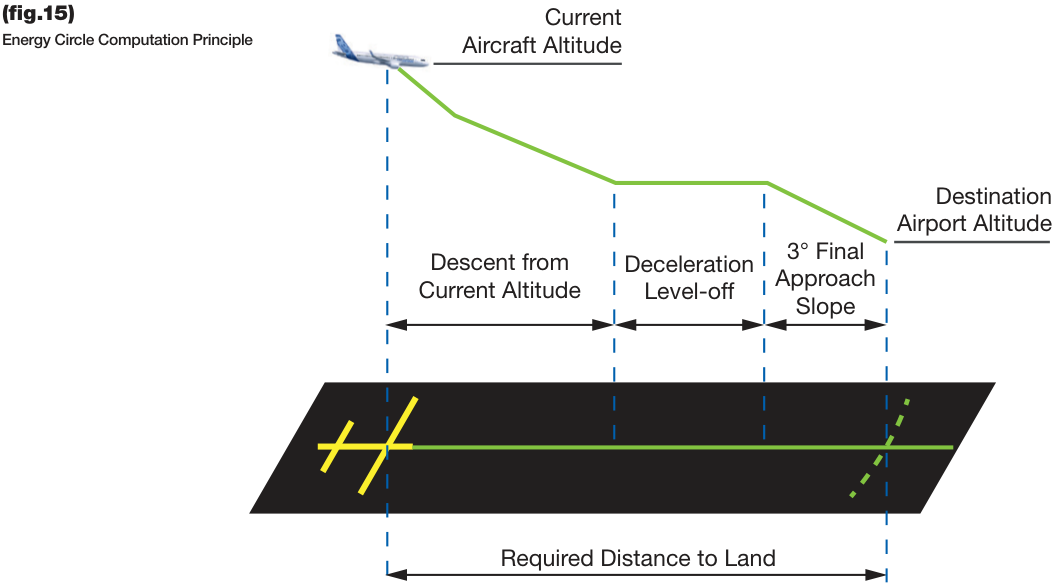
Section titled “Energy Circle”When in HDG or TRK lateral mode, the ND displays the energy circle, and when the aircraft is within 180 NM of its destination. It provides a visual cue of the minimum required distance to land, i.e. the distance required to descend in a straight line from the current aircraft position at its current speed down to the altitude of the destination airport at approach speed. The descent profile used to compute the distance takes into account speed limits, the wind, a deceleration level off segment and a 3° final approach segment (fig.15). In other words, if the destination airport is inside the energy circle, the flight crew needs to lose some energy by extending the speed brakes and/or modifying the aircraft’s trajectory, and/or increasing speed during descent.
In HDG or TRK lateral mode, the Energy Circle provides a visual cue of the minimum required distance to land.
PROCEDURES
Section titled “PROCEDURES”Control your Speed… During Descent, Approach and Landing
Another useful tool to use during descent is the level-off arrow provided by the FMS. It provides an indication to the fl ight crew of where the aircraft will reach the altitude selected on the FCU (fi g.16). A blending of actual wind conditions and the values for winds entered in the FMS are used to improve the accuracy of the computation. If in selected descent, the fl ight crew can adjust the speed of the aircraft to adapt the descent path or V/S to the situation.
(fi g.16)
Section titled “(fi g.16)”Level-off Arrow Computation Principle
Overspeed Avoidance during Descent
Section titled “Overspeed Avoidance during Descent”Manual Flight at Crossover Altitude
Section titled “Manual Flight at Crossover Altitude”When in descent close to MMO, if in manual fl ight (AP off), the risk of exceedance of the VMO at the crossover altitude is high. In this situation, the fl ight crew should know its crossover altitude and anticipate the switch to speed by reducing the aircraft pitch on approaching the crossover altitude.
Impact of Wind Direction
Section titled “Impact of Wind Direction”Flight crews should pay particular attention monitoring their speed in descent close to VMO/MMO and when fl ying close to the wind direction (fi g.17). The impact of a wind gradient can be signifi cant and bring the aircraft beyond VMO/MMO.
(fi g.17) Impact of wind direction
Flying close to the wind direction
Strong impact of potential wind gradients on aircraft speed
Flying far from the wind direction =
Limited impact of potential wind gradients on aircraft speed
Control your Speed… During Descent, Approach and Landing
PROCEDURES
Section titled “PROCEDURES”MANAGING SPEED DURING APPROACH AND LANDING
Section titled “MANAGING SPEED DURING APPROACH AND LANDING”Initial Approach
Section titled “Initial Approach”(fi g.18) Example of decelerated approach
When reaching the Initial Approach Fix (IAF) the fl ight crew should have a defi ned approach strategy based on the selected type of approach: a choice of the guidance mode that will be used and the associated approach technique (decelerated approach or early stabilized approach). The fl ight crew is then ready to start the key phase of the approach in terms of speed management: the Intermediate Approach phase.
DECELERATED APPROACH (WITHOUT CDA FUNCTION)
Section titled “DECELERATED APPROACH (WITHOUT CDA FUNCTION)”The decelerated approach is the default strategy used by the FMS to compute the descent and approach path. It is the recommended strategy for approaches using managed vertical guidance: ILS, GLS, SLS, MLS, FLS and FINAL APP.
in some cases, when the deceleration capabilities are low (e.g. heavy aircraft, a high elevation airport or tailwind), or for particular approaches with a deceleration segment located at low height, the fl ight crew should select CONF 2 before the FDP. The FCOM recommends to select CONF 2 before the FDP when the interception of the fi nal approach segment is below 2000ft AGL (A320) or 2500ft AGL (A330/A340, A350 and A380). In this case, for ILS, MLS or GLS approaches, or when using FLS guidance, it is good practice to select FLAPS 2 when one dot below the glideslope on the PFD deviation scale.
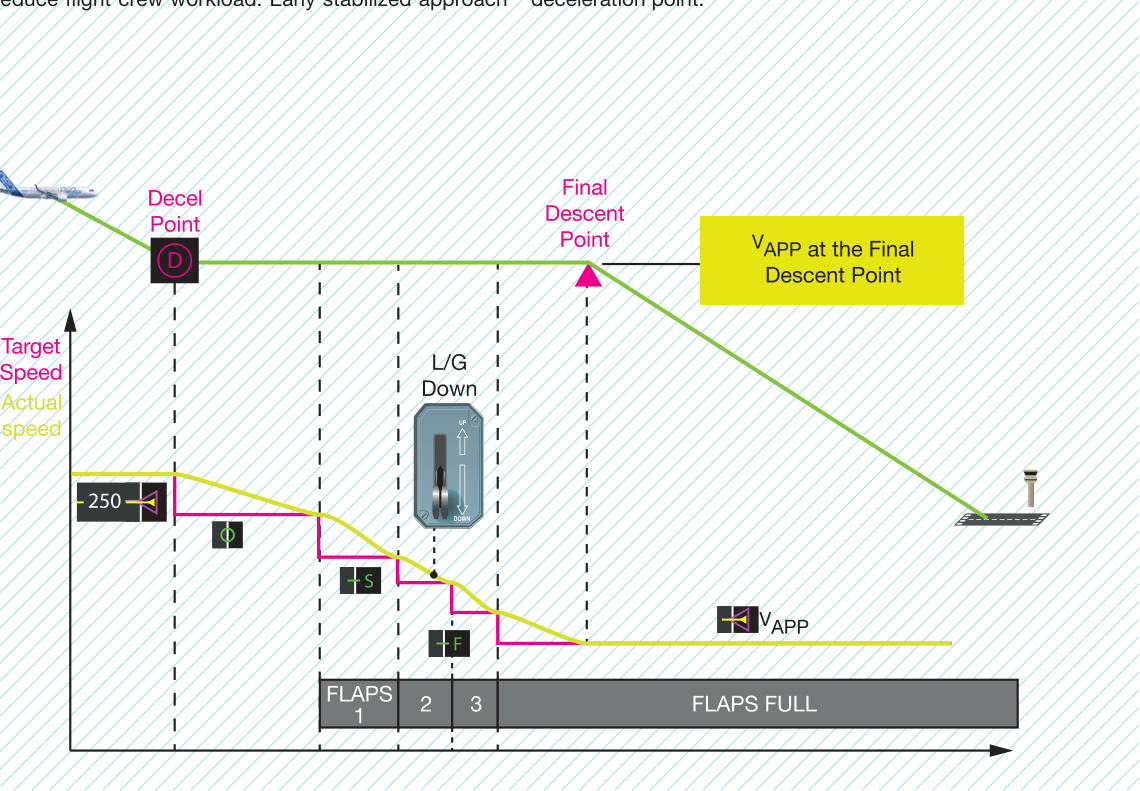
In a decelerated approach, the aircraft is decelerating during its fi nal approach segment to be stabilized at VAPP a t 1000ft above the airport elevation. In most cases, it reaches the Final Descent Point (FDP) in CONF1 at S speed. However,
Intermediate Approach
Section titled “Intermediate Approach”The Intermediate Approach phase starts at the deceleration point or earlier, if the fl ight crew activates manually the approach phase of the FMS.
The aircraft reduces speed from its last descent speed, generally 250kt, corresponding to the speed limit below FL100. The aircraft slows down to green dot speed and then slows further to the manoeuvring speed for the various Slats/ Flaps confi gurations. It fi nally ends up at VAPP at or before the stabilization point (decelerated approach) or at or before the Final Descent Point (early stabilized approach) depending on the approach strategy.
Airbus recommends using A/THR in managed speed to reduce crew workload. If the fl ight crew needs to use selected speed, they should revert to managed speed when out of the ATC speed constraint because it will ease the deceleration handling.
(fi g.19) Typical early stabilized approach
EARLY STABILIZED APPROACH (WITHOUT CDA FUNCTION)
Section titled “EARLY STABILIZED APPROACH (WITHOUT CDA FUNCTION)”The early stabilized approach is the recommended technique for approach using selected FPA vertical guidance. When the interception height of the final descent segment is low (below 2000ft for A320 or 2500ft for A330, A340, A350 and A380), it may also be used as an alternative to the decelerated approach to reduce fl ight crew workload. Early stabilized approach
can also be used when the weather conditions make it too diffi cult to use the decelerated approach. During an early stabilized approach, the aircraft reaches the FDP at VAPP and in its landing confi guration. To do so, the fl ight crew enters a speed constraint at the FDP in the FMS fl ight plan to enable the FMS to compute an associated deceleration point.
Control your Speed… During Descent, Approach and Landing
PROCEDURES
Section titled “PROCEDURES”The deceleration rate of the aircraft varies with its weight. A heavy aircraft will not decelerate as quickly as a lighter aircraft.
(fi g.20) Typical CDA approach
Whatever the Approach technique chosen by the fl ight crew (decelerated or early-stabilized approach), respecting stabilization criteria is key for a successful landing. Refer to the Flight Crew Operating Manual FCOM/PRO-NOR-SOP-18-A Stabilization Criteria.
CONTINUOUS DESCENT APPROACH (CDA) FUNCTION
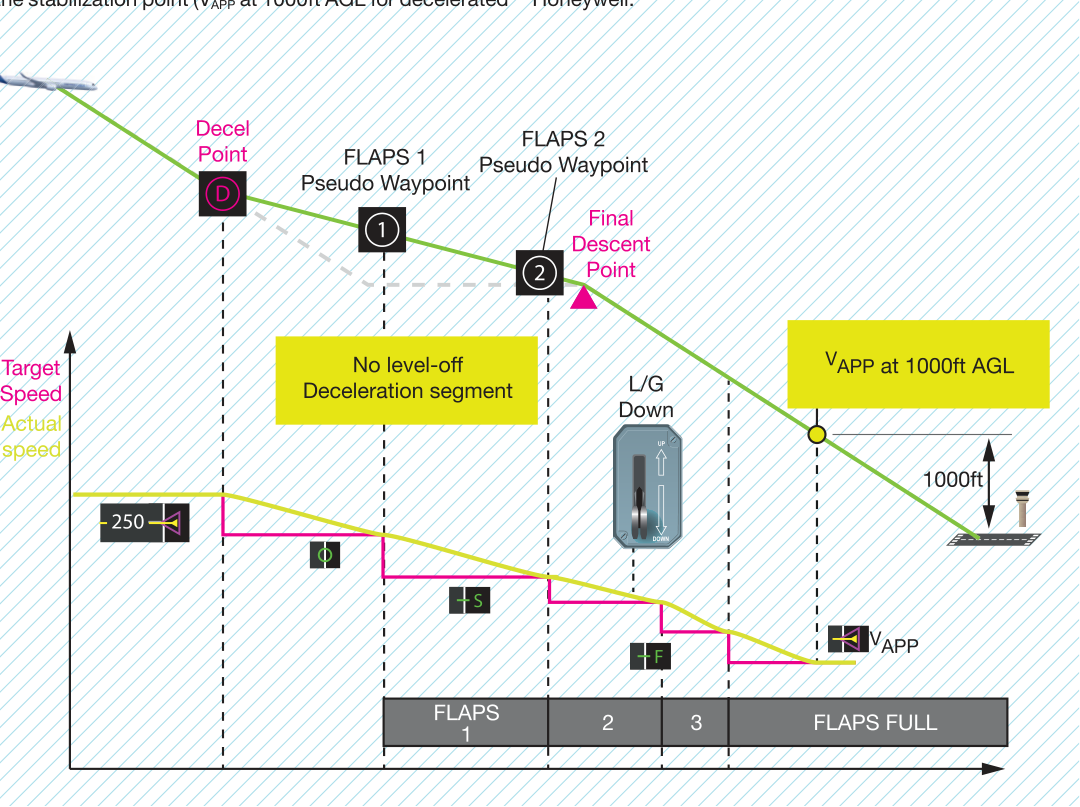
Section titled “CONTINUOUS DESCENT APPROACH (CDA) FUNCTION”The CDA function removes the deceleration level-off segment for fuel economy and noise reduction purposes. The function displays pseudo waypoints on the ND to indicate where to extend the fl aps at the latest to reach the stabilization point (VAPP at 1000ft AGL for decelerated
approaches and Vapp at the FDP for early stabilized approached). CDA is basic on A350 aircraft and will be available as an option on A320 and A330 aircraft families on aircraft equipped with Release2 FMS standards from Honeywell.
BEST PRACTICE
Section titled “BEST PRACTICE”If needed and below VLO/VLE, early extension of the landing gear can help the aircraft to decelerate. The additional drag of the landing gear has a strong effect on the aircraft deceleration rate.
Final approach and landing
Section titled “Final approach and landing”Speed Monitoring during approach and landing
Section titled “Speed Monitoring during approach and landing”When close to the ground, the wind can change, especially when in gusty conditions, and have a direct impact on the aircraft speed. As a consequence, monitoring of airspeed is crucial during final approach and landing to avoid:
Monitoring of airspeed is crucial during final approach and landing.
-
Runway undershoot, hard landing or tail strike if the aircraft speed becomes too low, or
-
Runway overrun if the speed becomes too high.
If gusty conditions are expected at the destination airport, the flight crew can add an appropriate margin to the VAPP and manually enter the new VAPP in the FMS PERF APPR page.
Airbus recommends the use of autothrust during final approach to reduce crew workload and benefit from the Ground Speed Mini function (GS mini).
Control your Speed… During Descent, Approach and Landing
PROCEDURES
Section titled “PROCEDURES”WHAT IS THE GROUND SPEED MINI FUNCTION?
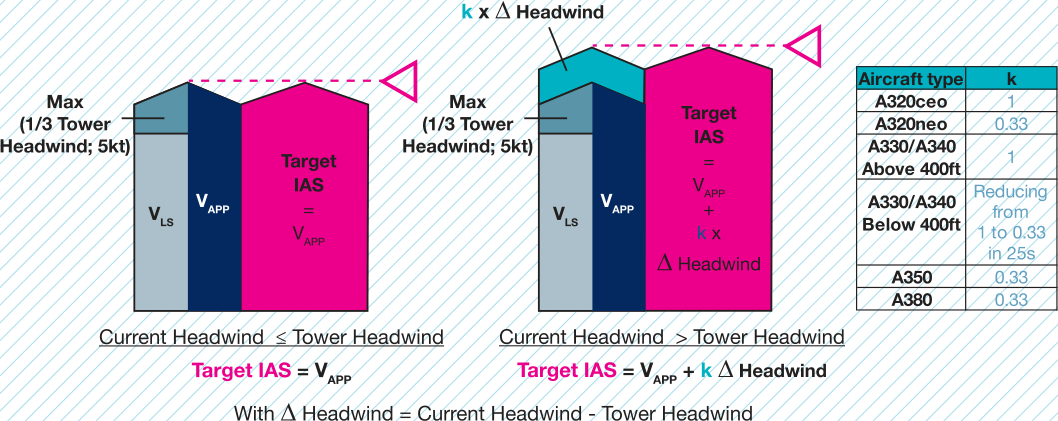
Section titled “WHAT IS THE GROUND SPEED MINI FUNCTION?”Significant headwind changes can be caused by the boundary layer effect when the aircraft is getting closer to the ground. Ground speed mini function ensures that the aircraft speed remains at least at VAPP if a stronger than expected headwind were to suddenly drop to the tower wind value or below. The GS mini function is only available when the fl ight crew uses the managed SPEED mode.
The AFS constantly computes and displays a target Indicated Airspeed (IAS) using:
-
The approach speed (VAPP computed by the AFS or manually entered in the FMS),
-
The tower headwind component from the tower wind value entered by the fl ight crew in the PERF APPR page of the FMS, and
-
The current wind measured by the ADIRS.
As a consequence, the fl ight crew must ensure that the tower headwind value has been correctly entered in the FMS, even if it does not increase the VAPP (i.e. headwind < 15kts).
(fi g.21)
Section titled “(fi g.21)”Ground speed mini function
Why is there a different ‘k’ factor for ground speed mini depending on the aircraft model?
Section titled “Why is there a different ‘k’ factor for ground speed mini depending on the aircraft model?”The factor of 1 used on A320ceo aircraft could not be used for the other aircraft models due to differences of their deceleration capability. The A320ceo has a stronger deceleration capability when compared to A320neo, A330/A340 family aircraft, A350 and A380 aircraft.
In the case of a strong ground effect, a lower deceleration capability may lead to an excessive speed at fl are. For example, a 20kt headwind at 200ft that reduces to 5kt on ground (corresponding to the 5kt tower headwind
inserted in FMS PERF APPR page), a factor of 1 requires a deceleration of 15kt to reach VAPP. With a k value of 0.33, the aircraft only needs to decelerate by 5kt to compensate its lower deceleration capability. It reduces the risk of excessive speed at fl are. The drawback is that there is a slight increase in thrust variations in gusty conditions, since the speed increment will not be suffi cient to counteract the IAS increase due to a gust. The best overall compromise was demonstrated to be a 0.33 factor.
Manual Landing
Section titled “Manual Landing”In Normal or alternate law, the flight controls maintain the aircraft load factor demand (flight mode), if there is a wind change, the aircraft will maintain its path causing the speed to increase or decrease. This cannot be perceived by a pilot while looking outside, as the trajectory will not change (the aiming point will not move). Therefore, with autothrust disengaged, the flight crew must carefully monitor the speed as to detect any speed change. The role of the Pilot monitoring (PM) is key in this situation, especially when close to the ground.
Flight crews must respect the stabilisation criteria provided in the FCOM Standard Operating Procedures.
Stabilisation criteria
Section titled “Stabilisation criteria”Flight crews must respect the stabilisation criteria provided in the FCOM Standard Operating Procedures (SOPs). These criteria ensure a safe approach and landing. The aircraft must be at approach speed with stabilized thrust at the stabilisation height (1000 ft AGL in IMC, 500 ft in VMC or according to airline’s policy) If it is not the case, the PM should make a callout and a go around must be initiated if the flight crew assesses that the stabilisation can’t be obtained prior landing.
CONTRIBUTORS:
Section titled “CONTRIBUTORS:”Philippe CASTAIGNS Experimental Test Pilot
Lorraine DE-BAUDUS Flight Operations Standards & Safety management
The aircraft can be in either an over energy or low-energy situation at landing if the crew does not manage the aircraft’s speed correctly from top of decent, through approach and down to the flare. The consequences upon landing are increased risk of runway excursion, tail strike, hard landing or runway undershoot.
Whatever the level of automation chosen during descent, approach and landing, the flight crew should be aware of its capabilities, take full advantage of the tools available on airbus aircraft and apply the procedures and techniques provided in the FCOM/QRH and FCTM.
Safety fi rst
Section titled “Safety fi rst”Safety fi rst, #24 August, 2017. Safety fi rst is published by Airbus S.A.S. - 1, rond point Maurice Bellonte - 31707 Blagnac Cedex/France. Publisher and Editor: Yannick Malinge, Chief Product Safety Offi cer. Concept Design by Airbus Multi Media Support 20171210. Reference: X00D16031905 Issue 24. Photos by Airbus, Lindner Fotografi e, S. Ramadier, H. Goussé, P. Masclet, F. Lancelot, A, Doumenjou, J. V. Reymondon, A. Tchaikovsky, C. Sadonnet, P. Pigeyre, A. Balazh. Computer renderings by Fixion.
控制你的速度……在下降、进近和着陆阶段
控制你的速度……在下降、进近和着陆阶段
Section titled “控制你的速度……在下降、进近和着陆阶段”本文是我们关于飞行中速度管理主题的总结,该主题始于《Safety First》第18期。现在我们进入下降阶段。我们的目标是从巡航高度下降至目的地机场,并为进近和着陆做好准备。
本文旨在阐明参考速度、限制速度和运行速度在下降、进近和着陆阶段的作用。文章还描述了可用工具,并就如何在飞行最后阶段管理飞机能量提供了运行建议。
能量管理,进而是速度管理,在下降、进近和着陆阶段至关重要。在巡航高度以巡航速度飞行的飞机,在到达目的地机场并以适当速度着陆之前,需要消散大量能量。下降阶段速度管理不当可能导致最后进近阶段能量过剩。事实证明,这是跑道偏出事件的主要原因。
管理你的下降、进近和着陆:了解速度
Section titled “管理你的下降、进近和着陆:了解速度”绿点速度是当FMS进近阶段激活时,形态(CONF CLEAN)下的管理速度目标。
与之前的飞行阶段一样,绿点、S和F速度在下降和进近阶段为飞行机组提供指导。
绿点(GD)速度
Section titled “绿点(GD)速度”GD速度**(图1)**是形态下的发动机失效运行速度。它提供了最佳升阻比速度的估算值。
GD速度是当FMS进近阶段激活时,形态(CONF CLEAN)下的管理速度目标。它也是选择形态1(CONF 1)时伸放襟翼的推荐速度,以及形态(CONF CLEAN)下等待的推荐速度。
GD速度是如何计算的?
Section titled “GD速度是如何计算的?”自动飞行系统(AFS)使用飞机重量计算GD速度,重量基于飞行准备阶段在FMS中输入的无燃油重量(ZFW)和气压高度。GD公式的设定使得在给定高度和飞机重量、形态(CONF CLEAN)单发失效的情况下,所得空速提供最佳升阻比。
在某些飞行阶段,GD的计算是为了使阻力最小化,从而降低燃油消耗(例如在等待阶段)。
控制你的速度……在下降、进近和着陆阶段
在进近阶段,S速度是当处于形态1或1+F时的管理速度目标。它是选择形态2(CONF 2)的推荐速度。
当缝翼/襟翼控制手柄位于位置1(形态1或1+F)时,它在PFD空速刻度上显示为绿色”S”(图2)。
在进近阶段,F速度是当处于形态2或3时的管理速度目标。它是在形态2时选择形态3(CONF 3)的推荐速度,在形态3时选择全形态(CONF FULL)的推荐速度。
当缝翼/襟翼控制手柄在进近阶段和复飞期间处于形态2或3时,它在PFD空速刻度上显示为绿色”F”(图3)。
S和F速度是如何计算的?
Section titled “S和F速度是如何计算的?”S和F速度通过使用相应形态的失速速度(Vs1g)乘以根据飞机类型的特定系数得到。保留了与着陆时的最小控制速度(VMCL)(在飞行测试中确定)以及下一形态伸出襟翼时的最大速度(VFE NEXT)的裕度:
S或F = VS1G × 系数
Section titled “S或F = VS1G × 系数”S = k × VS1G 形态(1.21 ≤ k ≤ 1.23)
FCONF2 = k × VS1G 形态2(1.38 ≤ k ≤ 1.47)
FCONF3 = k × VS1G 形态3(1.32 ≤ k ≤ 1.36)
PFD速度刻度上的F速度
在下降、进近和着陆阶段,飞机运行也被限制速度所约束。它们在PFD上或标牌上的指示使飞行机组能够轻松识别飞机速度包线。
VMAX:最大速度
Section titled “VMAX:最大速度”VMAX是定义飞机飞行包线的最大速度。VMAX等于:
- 起落架收上时,形态(CONF CLEAN)下的VMO/MMO。
- 起落架收上时,增升形态下的VFE。
- 起落架放下时,形态(CONF CLEAN)下的VLE/MLE。
- 起落架放下时,增升形态下VFE和VLE/MLE中的较小值。
在PFD空速刻度上,它对应红黑条的较低端**(图4)**。
VMO/MMO:最大运行速度/马赫数
Section titled “VMO/MMO:最大运行速度/马赫数”在形态(CONF CLEAN)下,VMO/MMO是飞机速度包线的上限。
VMO/MMO是如何计算的?
Section titled “VMO/MMO是如何计算的?”VMO/MMO源自设计限制马赫/速度VD/MD,并应用了与飞机俯冲特性的相关裕度。关于VMO/MMO计算的更多详细信息,请参阅2016年1月出版的《Safety First》第21期。
VFE:缝翼/襟翼伸出时的最大速度
Section titled “VFE:缝翼/襟翼伸出时的最大速度”VFE 是缝翼或襟翼伸出时的最大速度。
每个形态对应一个 VFE。
当缝翼/襟翼伸出时,VFE 基于缝翼/襟翼手柄位置或实际缝翼/襟翼位置,显示在 PFD 速度刻度上作为 VMAX (图 5)。
|---|---|---|---| |||||
表:PFD 上 V 显示的信息来源
* A340-200/300。
每种缝翼/襟翼形态的 VFE 也可在驾驶舱的速度标牌上查看。
VFE 如何确定?
Section titled “VFE 如何确定?”VFE 基于缝翼/襟翼形态的结构限制速度加上一定余度确定。它是与飞机型号关联的固定值。
VFE NEXT
Section titled “VFE NEXT”VFE NEXT 的目的是提醒飞行机组在进近过程中可以伸出下一缝翼/襟翼形态的最大速度。
VFE NEXT 显示在 PFD 速度刻度上 (图 7)。
VFE NEXT 在飞行中、FL200 以下显示(A350 上为 FL220 以下)。
VFE 如何确定?
Section titled “VFE 如何确定?”VFE NEXT 是下一缝翼/襟翼形态的 VFE。
Control your Speed… During Descent, Approach and Landing
(图 8) A380 速度标牌示例
VLE /MLE:起落架伸出速度/Mach
Section titled “VLE /MLE:起落架伸出速度/Mach”VLE/MLE 是飞机在起落架伸出状态下飞行的最大速度/Mach。
当起落架伸出且 VLE/MLE 低于 VFE 时,VLE/MLE 显示在 PFD 速度刻度上作为 VMAX。它也可在驾驶舱的速度标牌上查看 (图 8)。
VLE 如何确定?
Section titled “VLE 如何确定?”VLE 的确定需考虑在起落架伸出状态下提供足够的飞行包线,同时兼顾起落架和起落架舱门的结构限制。
VLO /MLO:起落架操作速度/Mach
Section titled “VLO /MLO:起落架操作速度/Mach”VLO/MLO 是操作(伸出和收上)起落架的最大速度/Mach。
VLO/MLO 不显示在 PFD 上;它可在驾驶舱的速度标牌上查看 (图 8)。
VLO/MLO 如何确定?
Section titled “VLO/MLO 如何确定?”由于扰流板伸出增加 VS1G,VLS 在扰流板伸出时增加。
VLO/MLO 的确定需考虑在起落架伸出/收上过程中提供足够的飞行包线,同时兼顾起落架和起落架舱门的结构限制。
VLS:最低可选速度
Section titled “VLS:最低可选速度”VLS 是自动驾驶仪和自动推力的最低可选速度。即使选定的目标速度低于 VLS,A/THR 也将维持 VLS 作为最小值。VLS 由 PFD 速度刻度上琥珀色条带的顶部指示 (图 9)。
VLS(选定着陆形态的:CONF 3 或 FULL)也显示在 FMS APPR 页面上。
对于下降和进近飞行阶段,线传飞机 VLS 的计算基于相应形态飞行测试中演示的失速速度(VS1G)乘以 1.23 的系数。在 A320 系列飞机上,某些缝翼/襟翼形态的系数可能增加,以改善机动性和/或增加与保护速度的余度。VLS 始终大于或等于着陆最低控制速度(VMCL)。
A320 系列:VLS = k × VS1G,其中 1.23 ≤ k ≤ 1.28
Section titled “A320 系列:VLS = k × VS1G,其中 1.23 ≤ k ≤ 1.28”VLS ≥ VMCL
Section titled “VLS ≥ VMCL”由于扰流板伸出增加 VS1G,VLS 在扰流板伸出时增加。
ECON DES 速度/Mach
Section titled “ECON DES 速度/Mach”ECON DES 速度/Mach 是降低下降直接运营成本的最优下降速度/Mach。
ECON DES 速度/Mach 如何确定?
ECON DES 速度/Mach 由 FMS 基于成本指数(CI)、巡航高度层和飞机重量计算。
VAPP:进近速度
ECON DES 速度/Mach 是降低下降直接运营成本的最优下降速度/Mach。
VAPP 是缝翼/襟翼处于着陆形态且起落架伸出时的最终进近速度。VAPP 显示在 FMS PERF APPROACH 页面上。
VAPP 如何确定?
VAPP 可由 AFS 计算或由飞行员通过 FMS PERF 页面手动输入。
VAPP 基于着陆形态的 VLS。对于空客飞机,在正常操作中,VAPP 定义如下:
VAPP = VLS 着陆形态 + 进近修正 AFS 计算的 VAPP
Section titled “VAPP = VLS 着陆形态 + 进近修正 AFS 计算的 VAPP”当由 AFS 计算时,AFS 使用的进近修正 (APPR COR) 为:进近修正 = 1/3 顶风分量,限制条件:5 节 ≤ 进近修正 ≤ 15 节。部分较旧的 A320 飞机除外,这些飞机 AFS 使用的进近修正为 1/3 顶风分量 + 5 节,限制在 15 节。
飞行机组计算的 VAPP 飞行机组可选择通过计算自己的进近修正来插入任意 VAPP,计算方法如下:
进近修正 = 以下各项的最大值:
- 若 A/THR 接通,则为 5 节
- 若存在积冰,则为 5 节(A320 系列在 CONF 3 时为 10 节而非 5 节)
- 1/3 顶风分量(不含阵风)
- 飞行机组速度增量 () () 在某些情况下(如阵风条件或强侧风),飞行机组可选择高于 AFS 计算值的 V,并认为这是符合飞行技艺的,但进近修正 ≤ 15 节。
在自动着陆时,或当 A/THR 接通时,或存在积冰或阵风侧风大于 20 节的情况下,VAPP 不得低于 VLS + 5 节。
控制您的速度… 在下降、进近和着陆阶段
系统故障时的 VAPP
Section titled “系统故障时的 VAPP”在飞行中发生系统故障时,飞行机组需计算新的 VAPP 值:
VREF = VLS CONF FULL
Section titled “VREF = VLS CONF FULL”∆VREF 为与故障相关的速度增量,用于抵消相关操控品质问题和/或失速速度增加。
进近修正取决于 ∆VREF、积冰情况、顶风分量以及自动推力的使用。
有关飞行机组在故障情况下确定 VAPP 的更多信息,请参阅《飞行机组技术手册》(FCTM)。
FMS 可计算精确且优化的下降剖面,前提是在下降准备阶段已在 FMS 中输入下降风,并且 PERF 和 IDLE 参数已根据实际飞机性能进行了调谐。
下降阶段的速度管理
Section titled “下降阶段的速度管理”飞行管理系统 (FMS) 计算的下降剖面是一个非常有效且实用的工具,可帮助飞行机组管理下降和进近阶段的飞机能量。
下降剖面计算
Section titled “下降剖面计算”FMS 可计算精确且优化的下降剖面,前提是在下降准备阶段已在 FMS 中输入下降风,并且 PERF 和 IDLE 参数已根据实际飞机性能进行了调谐。
为确定下降顶点 (T/D) 的位置,FMS 从复飞点 (MAP) 向后计算下降剖面,假设飞机在跑道入口上方 1000 英尺处稳定于 VAPP,一直计算到 T/D。
FMS 假设使用管理速度,并考虑 FMS 飞行计划上编入的所有速度和高度限制。参见 (图 10)。
在下降、进近和着陆阶段,管理速度等于以下各项之一:
- ECON DES 速度或在 FMS PERF DES 页手动输入的下降速度,或
- 速度限制,或
- 当前飞机形态的机动速度,或
- VAPP。
(图 10)
Section titled “(图 10)”
典型的管理下降剖面(无连续下降进近 (CDA) 功能)
控制您的速度… 在下降、进近和着陆阶段
风对下降轨迹的影响
Section titled “风对下降轨迹的影响”FMS 计算的下降轨迹使用在 DESCENT WIND 页面输入的预测风。然而,在飞行中,实际条件可能与预测值不同。因此,预测下降风与实际风之间的差值 (∆wind) 会影响飞机的行为。如果保持目标速度(如 OP DES 模式),飞机会倾向于偏离 FMS 计算的慢车轨迹 (图 11)。
管理下降 (DES)
Section titled “管理下降 (DES)”管理下降模式引导飞机沿 FMS 计算的垂直飞行轨迹。当条件允许时首选 DES 模式,因为它确保了高度限制的管理,并在以 ECON DES 速度飞行时降低了运营成本。
DES 模式仅在飞机沿着 FMS 横向飞行计划飞行时可用,即当飞机使用 NAV 水平引导模式时。
(图 12)
Section titled “(图 12)”管理下降怠速航段期间的速度范围原理。
∆ 风(FMS 风与实际风的对比)
Section titled “∆ 风(FMS 风与实际风的对比)”
在 DES 模式下使用管理速度,升降舵调整俯仰以使飞机保持在计算轨迹上,A/THR 命令慢车推力。
AFS 允许飞机速度在管理速度目标值附近 +/- 20 海里的范围内变化(在速度限制情况下为 +5 海里或 -20 海里),限制在 VMAX -5 海里以内以保持在轨迹上:
-
如果速度下降至其下限,A/THR 将增加推力
-
如果速度达到其上限,飞机将偏离轨迹以保持上限速度。
Control your Speed… During Descent, Approach and Landing
在几何航段上
Section titled “在几何航段上”在几何航段上,A/THR 调整推力以保持管理速度目标。
在 DES 模式下使用减速板
Section titled “在 DES 模式下使用减速板”在 DES 模式下使用减速板必须限于以下情况:存在强烈顺风或远低于预期的顺风,且飞机偏离剖面。飞行机组应通过放出减速板增加阻力 (图 12)。
作为视觉提示,ND 显示飞机以半速刹车伸展到达剖面的截获点。如果飞行机组不放出减速板,截获点将沿飞行计划持续前移。如果截获点接近高度限制,FMA 和 MCDU 草稿栏/MFD 上会显示 “MORE DRAG” 或 “EXTEND SPD BRK” 信息。
注: 对于配备 HONEYWELL P5 FMS 2 第 2 版本的 A350 和 A330,速度范围在 FL 100 以下不适用。在这种情况下,飞机保持在轨迹上,飞行机组必须监控速度并在适当时使用减速板。
在 OP DES 模式下,A/THR 命令慢车推力,升降舵调整俯仰以保持目标速度。
选择下降(OP DES 和 V/S)
Section titled “选择下降(OP DES 和 V/S)”在 OP DES 模式下,AFS 命令慢车推力,升降舵调整俯仰以保持目标速度(管理或选择)。
(图 13)
Section titled “(图 13)”调整选择速度以修改下降轨迹。
OP DES 模式可用于增加或减小下降坡度。在 OP DES 中,飞行机组调整目标速度以修改下降轨迹 (图 13)。
选择速度增加 = 下降坡度增加
飞行机组可在下降期间使用 V/S 模式,通过使用 V/S 选择器调整 V/S 来获得精确引导,以恢复预期的飞行轨迹。
在 V/S 模式下,AFS 调整俯仰和推力以保持选择的垂直速度和目标速度。
下降期间能量管理工具
Section titled “下降期间能量管理工具”V/DEV 指示
Section titled “V/DEV 指示”当处于 NAV 横向模式时,飞行机组使用”溜溜球”指示来估计其相对于 FMS 计算轨迹的位置。垂直偏差(V/DEV)值显示在 FMS PROG 页面(A320/A330/A340)(图 14) 或 PERF DES 页面(A380/A350)上。
(图 14)
Section titled “(图 14)”PFD 和 FMS PROG 页面上的 V/DEV 指示示例(A320)
当处于 HDG 或 TRK 横向模式时,且飞机距目的地 180 海里以内,ND 显示能量圈。它提供所需最小着陆距离的视觉提示,即从飞机当前位置以其当前速度沿直线下降至目的地机场的进近高度所需的距离。用于计算距离的下降剖面考虑了速度限制、风、减速平飞航段和 3° 最后进近航段 (图 15)。换言之,如果目的地机场位于能量圈内,飞行机组需要通过放出减速板和/或修改飞机轨迹和/或在下降期间增加速度来消耗一些能量。
在 HDG 或 TRK 横向模式下,能量圈提供所需最小着陆距离的视觉提示。
Control your Speed… During Descent, Approach and Landing
下降期间另一个有用的工具是 FMS 提供的平飞箭头。它向飞行机组显示飞机将在何处达到 FCU 上选择的高度 (图 16)。计算中结合了实际风条件和 FMS 中输入的风值,以提高计算的准确性。如果处于选择下降,飞行机组可以调整飞机速度以适应下降轨迹或 V/S 来匹配当前情况。
平飞高度转换计算原理
下降过程中的超速规避
Section titled “下降过程中的超速规避”交叉高度下的人工飞行
Section titled “交叉高度下的人工飞行”当在接近 MMO 的下降过程中进行人工飞行(AP 断开)时,在交叉高度超过 VMO 的风险很高。在这种情况下,飞行机组应了解其交叉高度,并通过在接近交叉高度时减小飞机俯仰来预判速度切换。
飞行机组应在下降过程中接近 VMO/MMO 以及在接近风向 (图17) 飞行时特别注意速度监控。风切变的影响可能很大,并可能导致飞机超过 VMO/MMO。
(图17) 风向的影响
接近风向飞行
潜在风切变对飞机速度的强烈影响
远离风向飞行 =
潜在风切变对飞机速度的有限影响
控制你的速度……下降、进近和着陆期间
进近和着陆期间的速度管理
Section titled “进近和着陆期间的速度管理”(图18) 减速进近示例
当到达初始进近点(IAF)时,飞行机组应根据所选的进近类型制定明确的进近策略:选择将要使用的引导模式及相关的进近技术(减速进近或提前稳定进近)。随后,飞行机组准备开始进近中速度管理的关键阶段:中间进近阶段。
减速进近(不带 CDA 功能)
Section titled “减速进近(不带 CDA 功能)”减速进近是 FMS 计算下降和进近轨迹的默认策略。这是使用管理垂直引导进近的推荐策略:ILS、GLS、SLS、MLS、FLS 和 FINAL APP。
在某些情况下,当减速能力较低(例如重型飞机、高海拔机场或顺风),或对于在低高度有减速段的特殊进近,飞行机组应在 FDP 之前选择 CONF 2。FCOM 建议在 FDP 之前选择 CONF 2,当最后进近航段的截获高度低于 2000ft AGL(A320)或 2500ft AGL(A330/A340、A350 和 A380)时。在这种情况下,对于 ILS、MLS 或 GLS 进近,或使用 FLS 引导时,良好做法是在 PFD 偏差刻度上低于下滑道一个点时选择 FLAPS 2。
在减速进近中,飞机在其最后进近航段中减速,在机场标高以上 1000ft 处稳定在 VAPP。在大多数情况下,它以 S 速度在 CONF1 到达 FDP。但是,
中间进近阶段始于减速点,或如果飞行机组手动激活 FMS 的进近阶段,则更早开始。
飞机从其最后下降速度(通常为 250kt,对应于 FL100 以下的速度限制)开始减速。飞机减速至绿点速度,然后进一步减速至各缝翼/襟翼构型的机动速度。最终在稳定点(减速进近)或之前到达 VAPP,或在最后下降点(提前稳定进近)或之前到达 VAPP,具体取决于进近策略。
空客建议使用 A/THR 管理速度模式以减少机组工作负荷。如果飞行机组需要使用选择速度,当脱离 ATC 速度限制时应恢复管理速度,因为这将简化减速处理。
(图19) 典型提前稳定进近
提前稳定进近(不带 CDA 功能)
Section titled “提前稳定进近(不带 CDA 功能)”提前稳定进近是使用选择 FPA 垂直引导进近的推荐技术。当最后下降航段的截获高度较低(A320 低于 2000ft,A330、A340、A350 和 A380 低于 2500ft)时,也可作为减速进近的替代方案以减少飞行机组工作负荷。当天气条件使减速进近过于困难时,也可使用提前稳定进近。在提前稳定进近期间,飞机以 VAPP 和着陆构型到达 FDP。为此,飞行机组在 FMS 飞行计划中于 FDP 处输入速度限制,以使 FMS 能够计算相关的减速点。
控制你的速度……下降、进近和着陆期间
飞机的减速率随其重量而变化。重型飞机的减速不会像轻型飞机那样快。
(图20) 典型 CDA 进近
无论飞行机组选择哪种进近技术(减速进近或提前稳定进近),遵守稳定标准都是成功着陆的关键。参见飞行机组操作手册 FCOM/PRO-NOR-SOP-18-A 稳定标准。
连续下降进近(CDA)功能
Section titled “连续下降进近(CDA)功能”CDA功能取消了减速平飞阶段,以实现燃油经济性和噪音降低。该功能在ND上显示伪航点,以指示最晚在何位置放出襟翼以到达稳定点(减速进近时为距地面1000英尺高度的VAPP,早期稳定进近时为FDP的VAPP)。CDA是A350飞机的标准配置,在配备霍尼韦尔Release2 FMS标准的A320和A330系列飞机上可选装。
如果需要且在VLO/VLE以下,提前放下起落架可以帮助飞机减速。起落架产生的额外阻力对飞机减速率有显著影响。
最终进近和着陆
Section titled “最终进近和着陆”进近和着陆过程中的速度监控
Section titled “进近和着陆过程中的速度监控”接近地面时,风可能会发生变化,尤其是在颠簸条件下,会直接影响飞机速度。因此,在最终进近和着陆期间,监控空速至关重要,以避免:
进近和着陆期间监控空速至关重要。
- 如果飞机速度过低,可能导致跑道提前接地、硬着陆或擦尾;
- 如果速度过高,可能导致跑道冲出。
如果目的地机场预期会出现颠簸条件,机组可以在VAPP上增加适当的裕度,并在FMS PERF APPR页面上手动输入新的VAPP。
空客建议在最终进近期间使用自动推力,以减少机组工作负荷并利用地速最小功能(GS mini)。
Control your Speed… During Descent, Approach and Landing
什么是地速最小功能?
Section titled “什么是地速最小功能?”当飞机接近地面时,边界层效应可能导致显著的逆风变化。地速最小功能确保飞机速度至少保持在VAPP,以防比预期更强的逆风突然降至塔台风值或以下。GS mini功能仅在机组使用管理速度(SPEED)模式时可用。
AFS持续计算并显示目标指示空速(IAS),使用:
- 进近速度(由AFS计算的VAPP或在FMS中手动输入的VAPP);
- 由机组在FMS PERF APPR页面上输入的塔台逆风分量;
- 由ADIRS测量的当前风。
因此,机组必须确保塔台逆风值已正确输入FMS,即使它不会增加VAPP(即逆风 < 15节)。
地速最小功能
为什么地速最小的“k”因子因飞机型号而异?
Section titled “为什么地速最小的“k”因子因飞机型号而异?”由于不同飞机的减速能力存在差异,在A320ceo飞机上使用的因子1无法用于其他飞机型号。与A320neo、A330/A340系列飞机、A350和A380飞机相比,A320ceo具有更强的减速能力。
在强地面效应情况下,较低的减速能力可能导致拉平速度过大。例如,200英尺高度20节的逆风降至地面5节(对应FMS PERF APPR页面输入的5节塔台逆风),因子1需要减速15节才能达到VAPP。使用0.33的k值,飞机只需减速5节即可补偿其较低的减速能力。这降低了拉平时速度过大的风险。缺点是在颠簸条件下推力变化略有增加,因为速度增量不足以抵消阵风导致的IAS增加。实践证明,0.33因子是最佳的综合折衷方案。
在正常或备用法则下,飞控保持飞机载荷因子需求(飞行模式)。如果有风变化,飞机将保持其轨迹,导致速度增加或减少。从外部看,飞行员无法感知这一点,因为轨迹不会改变(瞄准点不会移动)。因此,在自动推力未衔接的情况下,机组必须仔细监控速度以检测任何速度变化。在这种情况下,监控飞行员(PM)的角色至关重要,尤其是在接近地面时。
机组必须遵守FCOM标准操作程序中提供的稳定化标准。
机组必须遵守FCOM标准操作程序(SOP)中提供的稳定化标准。这些标准确保安全的进近和着陆。飞机必须在稳定化高度(仪表气象条件IMC下距地面1000英尺,目视气象条件VMC下500英尺,或根据公司政策)达到进近速度并保持稳定推力。如果不符合条件,PM应进行喊话,如果机组评估在着陆前无法达到稳定化,则必须执行复飞。
Philippe CASTAIGNS 实验试飞员
Lorraine DE-BAUDUS 飞行运行标准与安全管理
如果机组在从下降顶点开始,经进近直到拉平的全过程中未能正确管理飞机速度,飞机在着陆时可能出现能量过剩或能量不足的状况。后果是跑道偏离、尾翼擦地、重着陆或跑道目视参考丢失的风险增加。
无论在下降、进近和着陆阶段选择何种自动化等级,飞行机组都应了解其能力,充分利用空客飞机上可用的工具,并执行 FCOM/QRH 和 FCTM 中提供的程序和技术。
Safety First
Section titled “Safety First”Safety First,#24 2017 年 8 月。Safety First 由空中客车 S.A.S. 出版——1, rond point Maurice Bellonte - 31707 Blagnac Cedex/法国。出版人与编辑:Yannick Malinge,首席产品安全官。概念设计由空客多媒体支持提供 20171210。参考编号:X00D16031905 第 24 期。照片由空客、Lindner Fotografi e、S. Ramadier、H. Goussé、P. Masclet、F. Lancelot、A. Doumenjou、J. V. Reymondon、A. Tchaikovsky、C. Sadonnet、P. Pigeyre、A. Balazh 提供。计算机渲染由 Fixion 完成。