Airbus Brake Testing
Source: Airbus Safety First URL: https://safetyfirst.airbus.com/airbus-brake-testing/ Published: 2014-01-29 Magazine Issue: 2014-01 Category: Flight Ops, brake, Brakes, Braking, cg, contaminated, contaminated runway, dry, landing, MERTO, RT, take off, TALPA,, test, wet PDF: Original PDF
Introduction
Section titled “Introduction”Regulatory aircraft performance is certified as a set of performance models and aircraft physical characteristics that are built and validated from flight test data. While the primary purpose of these models has always been to allow computation of aircraft performance for dispatch, the models used to determine the in-flight landing distances during approach preparation are derived from the same testing. Part of this model, affecting both the acceleratestop computation at take-off and the landing distance computation, are the characteristics of the braking system installed on the aircraft.
This article explains which flight tests are involved in the identification of the system characteristics and how they are conducted.
Frank CHAPMAN Lars KORNSTAEDT Robert LIGNEE Experimental Test Pilot Performance Expert Experimental Flight Test Engineer Flight Operations Support
Testing Method
Section titled “Testing Method”There are several objectives for brake testing of a transport category aircraft.
The primary objective is the requirement to model and demonstrate the overall stopping performance, during rejected take-off, including the challenging Maximum Energy Rejected Take-Off (MERTO), and of course during landing.
Initially, during the early development, some fine-tuning of the braking logic may be required to optimise the system functioning and efficiency. Later in the aircraft life, subsequent modifications to braking systems or significant components (e.g. a
new carbon component or a tyre of new technology) may need further evaluation and certification. Then, there is the need to consider the possible degraded states of braking and aircraft systems that contribute to the overall aircraft deceleration (ground spoilers, reversers, etc).
To model accurately the overall aircraft stopping performance, an assembly of different performance models needs to be considered:
-
A vertical loads model between the wheels during stopping, for effects of:
-
Aircraft centre of gravity position - At the most forward CG position, the non-braked nose gearwheels are
more highly loaded, the main gear braked wheels less so and therefore less overall braking effect achievable.
-
Deceleration - The higher the deceleration, the stronger the load transfer from the braked main gear wheels to the non-braked nose wheels.
-
An aircraft lift and drag model during the stop in the given aircraft configuration, including transients during the stop phase (e.g. ground spoilers deployment).
-
An engine thrust model in forward idle and possible reverser settings, including transients (e.g. major transient in Rejected Take-Off (RTO) from engines in TOGA to forward idle or reverse thrust).
– The braking model itself with transients (e.g. brake onset with max pedal application or auto-brake initiation).
We will not explain here how vertical loads, lift and drag, and engine thrust models are built and justified. However, they are included in addition to the braking model in order to provide an accurate and validated global aircraft model. We will focus here only on the braking model development and justification.
Maximum braking performance tests are carried out in a specific and controlled manner, not to optimise the figures obtained, but to perform tests that are reproducible, as for any valid scientific experiment. This also applies to performance tests other than maximum braking, for example as validation of how auto-brake systems are performing at landing. To measure stopping distances and record deceleration very precisely, we use differential GPS, and calm wind conditions, with a typical maximum of 10 kt axial and 5 kt cross wind.
Airline pilot reaction times are defined conservatively by regulation and are added by computation into the model (except when aircraft particularities and testing demonstrate a longer test pilot reaction time).
Brake fans are an important facilitating element: they shorten cooling periods on the ground between tests. Alternatively, with an accurate assessment of energy absorbed by the braking system from the flight test installation, we can choose to cool the brakes in the air maintaining gear down, provided the performance calculation indicates sufficient energy margin when taking off with hot brakes to still allow for the possibility of a safe rejected take-off should there be a genuine test emergency that warrants such action. It must be emphasised that this technique is a test technique only and not one recommended or allowed for “in-service use”. It requires detailed knowledge of brake energy consumption and remaining energy available.
Rejected Take-Off (RTO) Tests
Section titled “Rejected Take-Off (RTO) Tests”Rejected take-off performance measurements are done only on a DRY runway, with and without the use of the autobrake system (in RTO mode) and without
the use of thrust reverse. If done on an aircraft with a “light” flight test installation, V1 is set based upon current tower wind, and a calculation is made of the airspeed value required to give the precise ground speed needed to ensure the target energy into the brakes. On aircraft with a “heavy” or more developed flight test installation, the test pilots are provided with a dedicated speed scale display of ground speed: any wind shift will not alter the ability of the test pilot to accurately attain the target brake energy and the target V1 in ground speed.
For the unique max energy RTO test, performed at MTOW, the aircraft demonstrates the capacity to absorb the certified max energy into the brakes. Regulatory conditions require that tyres must all be in 90% plus worn condition and, for a successful test, no intervention by the fire crews is allowed for a period of 5 minutes post RTO.
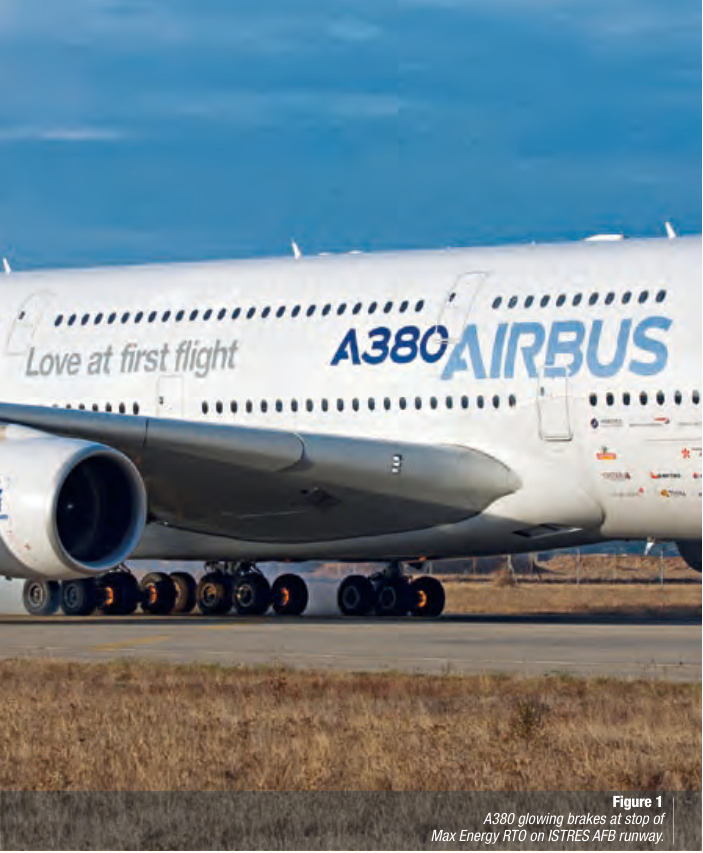
For Rejected Take-Off (RTO) tests, the aircraft is positioned so that braking is planned to start on a runway portion not significantly contaminated by heavy rubber deposits (typical on touch-down zones). The most demanding of these tests being the Max Energy RTO (fig. 1).
The test is typically done with auto-brake RTO mode selected and with the most critical engine cut (when there is a critical engine) at a target V1 (in ground speed): PM cuts the fuel to the critical engine whilst PF simultaneously slams the thrust levers to Idle without selecting Reverse. During the deceleration, the Flight Test Engineer monitors brakes function and should any brake unit fail he calls “Dead Brake”. In this case, the capacity to absorb energy by the remaining brakes is insufficient, and the PF has to disconnect the auto-brake and select max reverse, delaying braking. Hence the reason for using the longest
As a progressive approach to this test point, we perform some so-called ‘interrupted RTOs’ in order to ensure that the braking performance in the highest speed range is correctly identified for a precise and correct V1 speed target prediction for the final Max Energy RTO certification brake test. During these “interrupted RTOs”, the pilot applies several seconds max braking from close to the max energy limited value. He then
possible runway available to the Airbus test teams (ISTRES AFB).
If all functions correctly, the auto-brake brings the aircraft to a halt. Then, as we cannot block the ISTRES runway, we need to taxy clear before the wheel fuse plugs melt, typically 2 minutes after the stop. We come to a final halt on the preassigned safe parking area with minimum additional use of braking (as little brake capacity remains).
The V1 speed for thrust reduction and brake application has to be precisely calculated, as there is little margin for error. With a dedicated speed scale in ground speed, an accuracy within two tenths of a knot at a typical V1 of 160 kt plus is regularly achieved. The wheels and brakes are intentionally and effectively written off, so the Max Energy RTO is classed as a high risk test. Fire crews are pre-positioned to the side of the runway, listening on the tower frequency, but will only intervene in case of extreme necessity (engulfing fire) and only on flight test crew request: their intervention before a 5 minute period invalidates the test.
Intervention before braked wheels tyres are deflated is highly risky. In case of a wheel burst, pieces of metal of all sizes could be sent at high energy in
all directions ricocheting off gear legs and aircraft structure (it has happened). Therefore, the fire trucks are specifically configured to cool the brakes from a safe distance: hoses are set on fire truck front bumper, and cabin windshields are reinforced. Respect is rightly due to the fire crews, whose lives may be at risk should they be required to assist the flight crew in an evacuation.
At the end of the mandated 5 minutes period, with all tyres deflated, fire crews approach the aircraft and spray the gear with water, in order to rapidly cool the brakes and reduce the need for major aircraft repair beyond wheels, brakes and axles. The whole sequence is filmed for safety reasons and this film is part of the certification process as evidence of the 5 minute hold-over period.
Brake fans are never used during Max Energy RTO, as they come as an option on Airbus models. The parking brake is never set on during aircraft max energy tests to limit risk of hydraulic leaks at brake piston level, but it is demonstrated during max energy bench tests.
Finally, this test is always performed at the very end of the certification, as this minimises the risk to the certification program, since it could cause significant
airframe damage and render a critical and valuable test asset inoperable.
Should the test fail, as happened with one brake manufacturer during the A340-600 test campaign (due to a combination of detrimental factors, including a landing in extreme overweight the same morning at ISTRES AFB), then modifications to the brake and wheel assembly will be required to ensure compliance with the certification criteria. A second test will then be required with the embodied modifications.
Landings Tests
Section titled “Landings Tests”The ground distance from main gear touchdown to full stop is demonstrated by flight test only on a DRY runway. Measurements are done both with and without the use of the auto-brake system (in relevant modes) and without the use of thrust reverse (fig. 2).
Heavy rubber deposits (typical on touchdown zones) have a detrimental effect on brake performance. So, prior to a campaign of brake testing, historically, it was usual practice to clean the runway surface to get a reproducible optimum reference. This is no longer done due to the impact of a full week
The touchdown rate should be on the firm side (3-4 ft/sec), to avoid any bounce and asymmetry on the main gear and in order to have an unambiguous unique touchdown point. The aircraft must be positioned and maintained on the centreline, to avoid the braked wheels running over the painted centreline, which will reduce measured performance (or, in the case of an aircraft with a braked central gear such as A340-600, to allow for the slight loss of performance from the painted centre line). Engines must be at idle at touchdown, with the throttles chopped to idle at the “RETARD” automatic call out. At touchdown, manual braking is immediately applied to maximum pedal deflection, and maintained to the full stop, or auto-brake is left to control the
aircraft deceleration. Pilot control of the de-rotation, in order to minimise load upon nose-wheel touchdown, may be needed as max brake is applied through the derotation. Once on three points, the stick then has to be released for the rest of the ground roll whilst max braking or auto-brake is maintained, in order to avoid undue credit for nose-up elevator position, which would improve performance figures.
Thrust reverse is not used, except for those tests required to validate the reverse thrust model. This is obtained from separate tests with reversers used without braking.
Validation of Performance Models for WET and CONTAMINATED Runways
Section titled “Validation of Performance Models for WET and CONTAMINATED Runways”All flight tests are done on a DRY smooth runway. However analytical models for WET and more slippery runways (CONTAMINATED) are developed and validated.
The reference frictions for WET or CONTAMINATED runways are defined by regulation, EASA §25.109 for WET
and EASA §25.1591 for the defined CONTAMINATED runways (Compacted Snow, Loose Dry or Wet Snow, Standing Water and Slush of more than 3 mm depth, and Ice). Differences of this regulation with TALPA ARC recommendations are minor. These reference frictions are a compilation of historical data on research aircraft. The manufacturer, with a validated wheel loads model for the useful full range of decelerations and aircraft configurations, applies these legal reference frictions to its validated wheel loads models to obtain the appropriate RTO and landing distance performance.
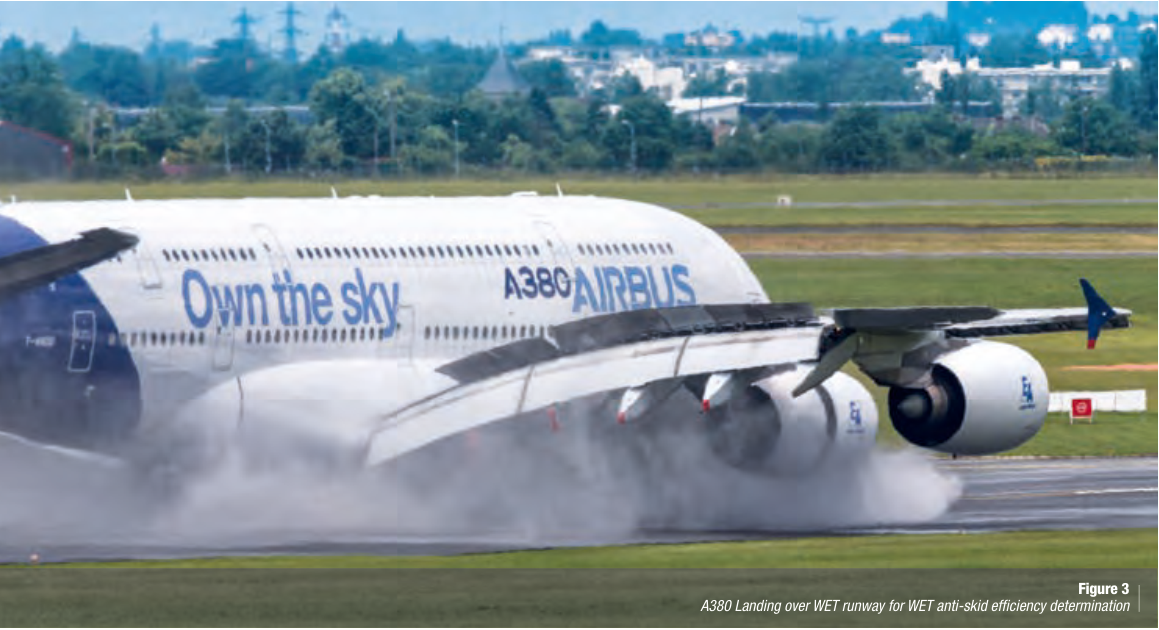
The only additional flight test validation required from us is the anti-skid efficiency on a WET smooth runway, up to the highest ground speed values that will be met in-service during RTO (which also covers the landing speed range). This is done through several RTO or landings in WET conditions (fig. 3). They are not direct performance measurements as such, but provide the validated anti-skid efficiency value obtained from analysis. By regulation, the highest efficiency that can be claimed for a fully modulating antiskid system is 92%. This efficiency has an effect on the certified RTO performance and on the provided landing distances on a WET runway.
If the manufacturer is not able to perform these tests, he can opt for a conservative default anti-skid efficiency value defined by the regulation, function of the anti-skid type being used.
Effective Friction (including anti-Skid Efficiency) used for Computation of RTO Distances, Dispatch and In-Flight Landing Distances
Section titled “Effective Friction (including anti-Skid Efficiency) used for Computation of RTO Distances, Dispatch and In-Flight Landing Distances”In-Flight Landing Distances
Section titled “In-Flight Landing Distances”Airbus took the initiative to develop and use the concepts of Operational Landing Distance (OLD) and Factored Operational Landing Distance (FOLD) for aircraft landing performance assessment on arrival. This initiative was based on an industry-wide consensus, forged by the FAA mandated TALPA ARC (Take-Off and Landing Performance Assessment Aviation Rulemaking Committee), and was described in Safety first Issue 10, August 2010.
The DRY runway friction and associated ground braking distance identified in the above tests is used directly for DRY RTO computations, and through regulatory coefficients for Dispatch computations towards DRY and WET runways. It is reduced by 10% for the determination of the in-flight LD towards DRY runways (to mitigate for heavier runway contamination by rubber than on legacy test runways).
From September 2012, these more realistic landing distance performance figures have been available to Airbus operators. They are now referred to in the Airbus documentation as Landing Distance (LD) and Factored Landing Distance (FLD).
The determination of the ground distance for the RTO and In-Flight LD WET computations is not based on specific flight tests, but is computed using a reference friction defined by regulation CS/ FAR25.109. This reference friction, based on a compilation of historical flight test data (fig. 4), is multiplied by a demonstrated WET runway anti-skid efficiency.
To cater for minor operational deviations, Airbus and TALPA ARC recommend a 15% factor be applied to the LD. With the resulting FLD, crews should now feel confident that the performance figures used operationally, with Airbus aircraft, are realistic for all runway conditions. This is provided correct assumptions have been made about the weather, aircraft and runway status and that there is no excessive abuse of normal approach and landing procedure.
The Dispatch and In-Flight LD computations towards CONTAMINATED runways is likewise based on reference frictions, which are based on a compilation of historical flight test data. These are defined in EASA AMC to CS25.1591and adjusted, in some cases, for In-Flight Landing Distances as per the proposed TALPA ARC guidance to FAR25.125 B.
|---|---|---|---|
Figure 4 Reference friction used for ground roll distances
(1) The In-Flight Performance Level corresponding to WET runway is GOOD. The specific credit for ground roll distances on WET Grooved or PFC (Porous Friction Course) runways will not be discussed here.
(2) The In-Flight Performance Levels corresponding to CONTAMINATED runways are expressed as GOOD TO MEDIUM, MEDIUM, MEDIUM TO POOR and POOR.
(3) Dispatch landing performance on WET is derived from the Dispatch Landing Distance on DRY and thus no specific WET friction definition is provided in the regulations.
Conclusion
Section titled “Conclusion”The primary objective of brake testing is to fulfil the requirement to model and demonstrate the aircraft’s overall stopping performance during rejected take-offs as well as landings.
This entails the determination, on a DRY runway, of the maximum capabilities of the braking system through a series of tests like the Max Energy RTO assessment and landing performance evaluation.
A combination of these flight tests and of analytical models derived from the compilation of historical flight test data, is utilized to calculate the braking performance on DRY, WET and CONTAMINATED runways for RTO, Dispatch as well as In-Flight Landing Distances determination.
来源: Airbus Safety First 网址: https://safetyfirst.airbus.com/airbus-brake-testing/ 发布日期: 2014-01-29 杂志期号: 2014-01 分类: 飞行运营, 刹车, 刹车系统, 制动, 重心, 污染, 污染跑道, 干燥, 着陆, MERTO, RT, 起飞, TALPA,, 测试, 湿跑道 PDF: 原始PDF
规章性 aircraft performance 是由一组性能模型和飞机物理特性构建和验证的,这些模型和特性源自 flight test data。虽然这些模型的主要目的始终是允许计算 aircraft performance 以进行放行,但用于在进近准备期间确定飞行中着陆距离的模型同样源自这些测试。该模型的一部分影响起飞时的加速中断(accelerate-stop)计算和着陆距离计算,即安装在飞机上的刹车系统的特性。
本文解释了 identification of the system characteristics 涉及哪些飞行测试以及如何进行这些测试。
Frank CHAPMAN Lars KORNSTAEDT Robert LIGNEE 试飞员 性能专家 飞行试验工程师 飞行运营支援
对运输类飞机进行刹车测试有 several objectives。
主要目标是需要对 overall stopping performance 进行建模和演示,包括具有挑战性的最大能量中断起飞(MERTO),当然也包括着陆。
最初,在早期开发阶段,可能需要对刹车逻辑进行一些微调,以优化系统功能和效率。在飞机生命周期的后期,对刹车系统或重要部件(例如新的碳材质部件或新技术轮胎)的后续改装可能需要进一步评估和认证。此外,还需要考虑刹车和飞机系统的 possible degraded states,这些系统对飞机整体减速有贡献(地面扰流板、反推等)。
为了准确建模整体飞机减速性能,需要考虑以下不同性能模型的组合:
-
刹车过程中轮子之间的垂直载荷模型,用于以下影响:
- 飞机重心位置 —— 在最靠前重心位置,未刹车的前轮载荷较大,主起落架已刹车轮载荷较小,因此可实现的 overall braking effect 较小。
- 减速度 —— 减速度越大,从已刹车的主起落架轮子转移到未刹车的前轮的载荷越多。
-
在给定飞机构型下减速过程中的飞机升力和阻力模型,包括停止阶段的瞬态(如地面扰流板展开)。
-
发动机推力模型,包括前推慢车和可能的反推设置,包括瞬态(如中断起飞时从TOGA发动机到前推慢车或反推的主要瞬态)。
– 刹车模型本身,包括瞬态(如最大脚蹬踩踏时的刹车启动或自动刹车启动)。
本文不解释垂直载荷、升力和阻力以及发动机推力模型是如何建立和验证的。然而,这些模型与刹车模型一起包含在内,以提供准确且经过验证的 global aircraft model。本文仅关注刹车模型的开发和验证。
最大刹车性能测试以 specific and controlled manner 进行,不是为了优化所获得的数值,而是为了进行可重现的测试,就像任何有效的科学实验一样。这也适用于最大刹车以外的性能测试,例如自动刹车系统在着陆时性能的验证。为了精确测量减速距离并记录减速度,我们使用差分GPS,在平静的风条件下,典型最大值为主风10节和侧风5节。
航空公司飞行员的反应时间由规章保守定义,并通过计算添加到模型中(除非飞机特殊性和测试表明需要更长的试飞员反应时间)。
刹车风扇是一个重要的辅助设备:它缩短了测试之间在地面的冷却时间。或者,通过对飞行试验装置吸收的刹车能量进行准确评估,我们可以选择在保持起落架放下在空中进行冷却,只要性能计算表明使用热刹车起飞时有足够的能量余量,仍然能够 allow for the possibility of a safe rejected take-off,以防出现真正需要此类行动的测试紧急情况。必须强调,这只是一种测试技术,而非“in-service use”推荐或允许的技术。它需要对刹车能量消耗和可用剩余能量有详细了解。
终止起飞(RTO)测试
Section titled “终止起飞(RTO)测试”只有在干燥跑道上进行终止起飞性能测量,包括使用和不使用自动刹车系统(RTO 模式)两种情况,且不使用反推。
如果在装有”轻型”飞行测试装置的飞机上进行,V1 根据当前塔台风向设定,并计算所需的地速值,以确保达到目标制动能量。对于装有”重型”或更完善的飞行测试装置的飞机,测试飞行员配备专用的地速刻度显示:任何风向变化都不会影响测试飞行员准确达到目标制动能量和目标地速 V1 的能力。
对于在最大起飞重量(MTOW)下进行的最独特的最大能量终止起飞测试,飞机展示将认证最大能量吸收至制动器的能力。法规要求所有轮胎必须处于 90% 以上磨损状态,且为使测试成功,终止起飞后 5 分钟内不允许消防人员介入。
对于终止起飞(RTO)测试,飞机的位置安排应使制动计划在跑道某段开始,该跑道段不应受到重橡胶沉积物的显著污染(通常在接地地带)。其中要求最严格的测试是最大能量终止起飞(图 1)。
测试通常选择自动刹车 RTO 模式进行,并在关键发动机(当存在关键发动机时)最关键的情况下于目标 V1(地速)切断:PM 切断关键发动机燃油的同时 PF 同时将推力手柄推至慢车但不选择反推。在减速过程中,飞行测试工程师监控制动功能,如有任一制动组件失效,他呼叫”失效制动”。在这种情况下,剩余制动器吸收能量的能力不足,PF 必须断开自动刹车并选择最大反推,推迟制动。因此使用
在渐进式方法进行此测试点时,我们执行一些所谓的”中断终止起飞”,以确保在最高速度范围内的制动性能被正确识别,从而为最终最大能量终止起飞认证制动测试提供精确正确的 V1 速度预测。在这些”中断终止起飞”期间,飞行员从接近最大能量限制值开始施加数秒最大制动。然后
空客测试团队可使用的最长跑道(伊斯特雷斯空军基地)。
如果所有功能正常,自动刹车使飞机停止。然后,由于我们不能阻塞伊斯特雷斯跑道,我们需要在轮毂熔断插头熔化之前滑出,通常在停止后 2 分钟内。我们在前指定的安全停机区域最终停住,尽量少使用额外制动(因为剩余制动容量很小)。
用于减小推力和施加制动的 V1 速度必须精确计算,因为几乎没有误差余地。通过专用的地速刻度,在典型 V1 为 160 节以上时,通常可达到精确到十分之一节的精度。机轮和刹车被故意彻底报废,因此最大能量终止起飞被归类为高风险测试。消防人员在跑道侧方预置就位,监听塔台频率,但仅在极端必要情况下(吞没性火灾)且仅在飞行测试机组请求时介入:5 分钟期限前的介入会使测试无效。
在制动机轮轮胎放气前介入存在高度风险。如果发生轮毂爆裂,各种尺寸的金属碎片可能以高能量向各个方向飞射,在起落架和飞机结构上弹跳(这种情况曾有发生)。因此,消防卡车专门配置为从安全距离冷却制动器:软管设置在消防车前保险杠上,驾驶舱挡风玻璃得到加强。消防人员应得的敬意是当之无愧的,如果需要他们协助飞行机组疏散,他们的生命可能处于危险之中。
在规定的 5 分钟期限结束时,所有轮胎已放气,消防人员接近飞机并向起落架喷水,以快速冷却制动器并减少除机轮、刹车和轮轴外对飞机进行大规模修理的需要。整个过程被拍摄记录以确保安全,该影片是认证过程的一部分,作为 5 分钟隔离期限的证据。
在最大能量终止起飞期间从不使用制动风扇,因为它们是空客机型的选装配置。在飞机最大能量测试期间从不设置停留刹车,以限制制动器活塞层面的液压泄漏风险,但这在最大能量台架测试中得到演示。
最后,此测试总是在认证的最后阶段进行,因为这将使认证项目的风险降至最低,因为它可能造成严重的机体损坏,并使关键的宝贵测试资产无法使用。
如果测试失败,正如 A340-600 测试项目中一家制动器制造商发生过的情况(由于多种不利因素的综合作用,包括当天上午在伊斯特雷斯空军基地的一次极端超重着陆),则需要对制动器和机轮组件进行改装,以确保符合认证标准。此后将需要使用已实施的改装进行第二次测试。
主起落架触地至完全停止的地面滑行距离仅在干跑道上通过飞行测试进行演示。测量分别在使用和不使用自动刹车系统(相关模式)且不使用反推的情况下进行(图 2)。
重橡胶沉积物(着陆区域常见)对刹车性能有不利影响。因此,在进行刹车测试活动之前,传统做法是清洁跑道表面以获得可重复的最佳参考值。由于需要占用整整一周的时间,目前已不再这样做。
触地速率应偏硬(3-4 ft/sec),以避免主起落架弹跳和偏斜,并确保有明确的唯一触地点。飞机必须定位于并保持在中心线上,避免刹车轮碾压画有标记的中心线,否则会降低测量性能(或对于装有刹车式中央起落架的飞机(如 A340-600),需考虑碾压画线中心线导致的轻微性能损失)。发动机在触地时应处于慢车状态,在“RETARD”自动提示时将油门杆切至慢车。触地后应立即实施人工刹车至最大踏板偏转,并保持至完全停止,或由自动刹车控制飞机减速。在最大刹车施加过程中,可能需要进行消旋控制以最小化前起落架触地时的载荷。一旦三点着地,需释放操纵杆以完成剩余地面滑行,同时保持最大刹车或自动刹车,以避免因前倾升降舵位置获得不当的性能 credited。
不使用反推,但用于验证反推模型的测试除外。反推性能通过单独测试获取,即仅使用反推而不施加刹车。
湿滑和污染跑道性能模型的验证
Section titled “湿滑和污染跑道性能模型的验证”所有飞行测试均在干燥平滑跑道上进行。然而,湿滑和更光滑跑道(污染跑道)的分析模型已开发并验证。
湿滑或污染跑道的参考摩阻值由法规规定:EASA §25.109(湿滑)和 EASA §25.1591(定义的污染跑道:压实雪、松散干/湿雪、超过 3 mm 深度的积水或泥浆以及冰)。该法规与 TALPA ARC 建议之间的差异很小。这些参考摩阻值是研究飞机历史数据的汇编。制造商使用经验证的轮载模型(涵盖减速和飞机构型的全部有用范围)将这些法规参考摩阻值应用于其经验证的轮载模型,以获得适当的 RTO 和着陆距离性能。
我们唯一需要的额外飞行测试验证是在湿滑平滑跑道上的防滑效率验证,验证范围需达到 RTO 运营中会遇到的最大地面速度(这也涵盖了着陆速度范围)。这通过在湿滑条件下进行多次 RTO 或着陆来完成(图 3)。这些并非直接的性能测量,而是通过分析获得经验证的防滑效率值。根据法规规定,全调制防滑系统可声称的最高效率为 92%。该效率对认证的 RTO 性能和提供的湿跑道着陆距离有影响。
如果制造商无法进行这些测试,可选择采用法规规定的保守默认防滑效率值,该值取决于所使用的防滑系统类型。
用于 RTO 距离计算、放行及飞行中着陆距离的有效摩擦系数(含防滑效率)
Section titled “用于 RTO 距离计算、放行及飞行中着陆距离的有效摩擦系数(含防滑效率)”飞行中着陆距离
Section titled “飞行中着陆距离”空客率先开发和应用了运行着陆距离(OLD)和因数化运行着陆距离(FOLD)的概念,用于评估飞机着陆性能。这一举措基于 FAA 主导的 TALPA ARC(起飞与着陆性能评估航空规则制定委员会)达成的行业共识,并在《Safety First》第10期(2010年8月)中进行了详细阐述。
上述测试中确定的干跑道摩擦系数及相关的地面制动距离直接用于干跑道 RTO 计算,并通过规章系数用于干跑道和湿跑道的放行计算。在确定飞行中湿跑道着陆距离时,该值减少 10%(以缓解因橡胶污染程度重于旧有测试跑道而带来的影响)。
自2012年9月起,这些更加切合实际的着陆距离性能数据已可供空客运营商使用。在空客文档中,它们现在被称为着陆距离(LD)和因数化着陆距离(FLD)。
RTO 和飞行中湿跑道 LD 的地面距离确定并非基于特定的飞行测试,而是依据 CS/FAR25.109 规章定义的参考摩擦系数进行计算。该参考摩擦系数基于历史飞行测试数据的汇编(图4),并乘以经演示验证的湿跑道防滑效率。
为应对轻微的运行偏差,空客和 TALPA ARC 建议对 LD 施加 15% 的系数。使用由此产生的 FLD,机组应能确信,空客飞机的运行性能数据在所有跑道条件下都是切合实际的。前提是对天气、飞机和跑道状况作出了正确的假设,且未对正常进近和着陆程序进行过度违规操作。
污染跑道的放行和飞行中 LD 计算同样基于参考摩擦系数,这些系数基于历史飞行测试数据的汇编。这些系数在 EASA AMC to CS25.1591 中定义,并按照 TALPA ARC 对 FAR25.125 B 的建议指南,在某些情况下对飞行中着陆距离进行了调整。
|---|---|---|---|
图4 用于地面滑行距离的参考摩擦系数
(1) 对应湿跑道的飞行中性能等级为良好。湿跑道上沟槽或 PFC(多孔摩擦层)跑道地面滑行距离的具体信用将不在此讨论。
(2) 污染跑道对应的飞行中性能等级表示为良好至中等、中等、中等至差和差。
(3) 湿跑道放行着陆性能由干跑道放行着陆距离推导而来,因此规章中未提供湿跑道的具体摩擦系数定义。
制动测试的主要目标是满足建模和演示飞机在中断起飞及着陆过程中整体减速性能的要求。
这需要通过一系列测试(如最大能量 RTO 评估和着陆性能评估)在干跑道上确定制动系统的最大能力。
这些飞行测试与分析模型的组合用于计算干跑道、湿跑道和污染跑道在 RTO、放行以及飞行中着陆距离确定中的制动性能。