Airbus New Operational Landing Distances
Source: Airbus Safety First URL: https://safetyfirst.airbus.com/airbus-new-operational-landing-distances/ Published: 2011-07-14 Category: Archive PDF: Original PDF
The Airbus Safety Magazine
Lars KORNSTAEdT
Section titled “Lars KORNSTAEdT”Performance Expert, Flight Operations Support
1. Introduction
Section titled “1. Introduction”The Operational Landing Distances (OLD) were described in an article titled “Operational Landing Distances - A New Standard for In-Flight Landing Distance Assessment” published in the tenth issue of Safety First, dated August 2010. This new standard is the outcome of the FAA Takeoff and Landing Performance Assessment Aviation Rulemaking Group (TALPA ARC), and considered a strong industry consensus. The article concluded that Airbus supported the OLD concept and would anticipate FAA rulemaking by providing operational documentation and computation tools to customers in the course of this year.
This paper describes the way the OLDs will be published from the end of the year by Airbus. Airlines should start planning the integration into their operations, especially concerning publication of the information and training of the concerned personnel.
2. Major Conceptual Changes
Section titled “2. Major Conceptual Changes”The TALPA ARC rulemaking recommendations to the FAA are a tightly integrated package of three sets of regulation proposals:
q To AIRPORTS, on the runway condition assessment and reporting mechanisms,
q To AIRCRAFT MANUFACTURERS, on the publication of inflight landing performance assessment data,
q To OPERATORS, on the time of arrival assessment.
Airbus is tackling the adaptation of its ground and on-board performance computation tools, and of the operational documentation to comply with the principles set down in the proposals. They will as well recommend best practices to their customers on how to use this information and take most advantage of the concept.
However, the regulatory framework for the OLD concept is not in place yet, even under FAA rule. The major consequence is that the use of the OLDs has to fit into an environment where runway condition reporting practices will not necessarily comply with the recommendations.
Another aspect is that the new inflight performance assessment may, under some conditions, be more constraining than currently applicable dispatch requirements. This is especially true under JAR/EASA rule. As a result, a runway that is dispatched to according to the current factored Available Landing Distances (ALDs) requirement may, as soon as the aircraft leaves the ground, become inappropriate according to the OLDs.
Airlines will have to put into place policies and training to enable crews to compensate for these shortcomings, until the rulemaking processes that have been initiated by FAA, ICAO and EASA come to fruition.
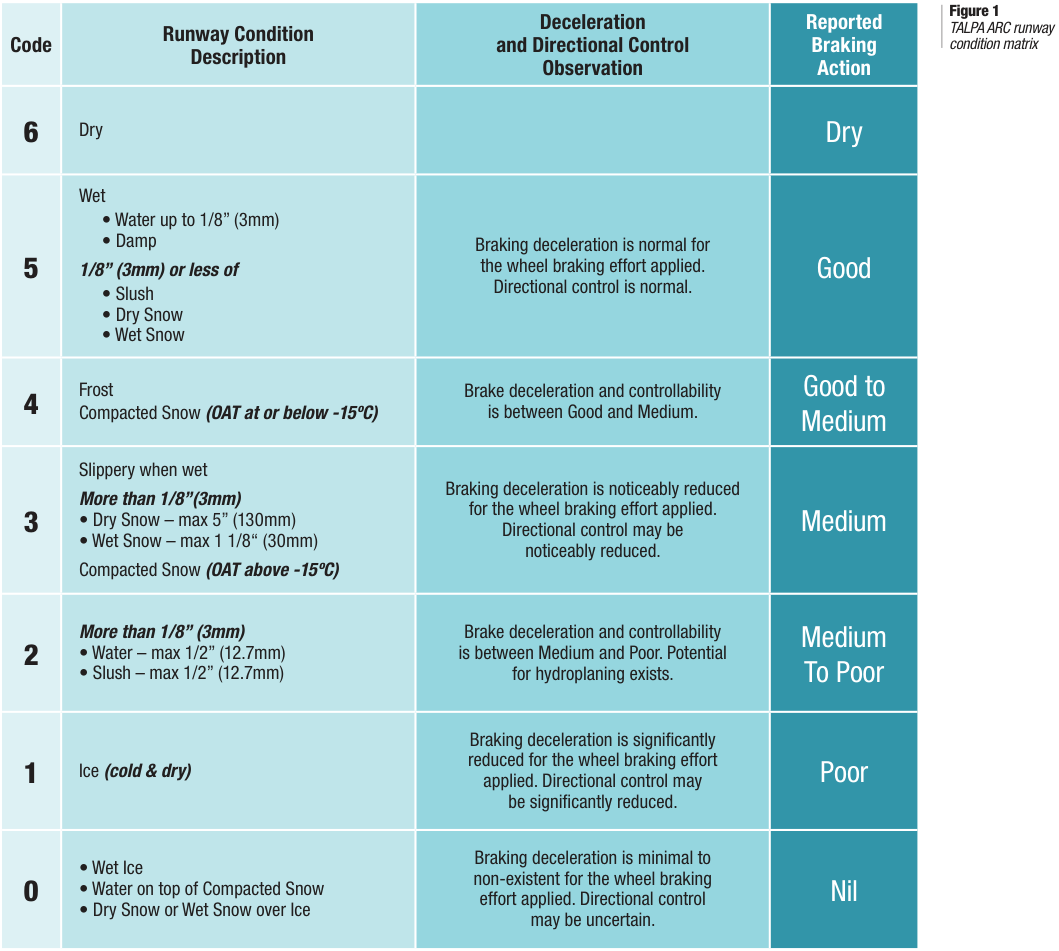
3. The Matrix
Section titled “3. The Matrix”The Runway Condition Assessment Table is the cornerstone of the OLD concept. It provides a mecha-
nism for mitigation of a number of real-life risks associated with performance computations based on contaminant type and depth only. These risks include:
q Disregard or wrong interpretation by the flight crew of reports of runway contaminants not covered in the performance computation options, like frost/rime or slippery when wet.
q Disregard or wrong interpretation by the flight crew of reported estimated friction or braking action (Pilot Report).
q Contaminant phase change around freezing point.
q Layered contaminants.
q Rapid change in conditions under active precipitation.
The TALPA ARC runway condition reporting process intends to cover a maximum of possible conditions, and to make a safe report to flight crew by considering all information that may be available. This does not mean that credit of accuracy is given to the subjective assessment made by a preceding pilot or to a continuous friction measurement, for which the lack of correlation with aircraft performance has been extensively discussed over the years. However, the indicators given by such information, when available, should be used to downgrade a primary assessment made on the basis of the contaminant type and depth.
Safety
4. Implementation
Section titled “4. Implementation”4.1. Certified Airplane Flight Manual (AFM)
Section titled “4.1. Certified Airplane Flight Manual (AFM)”The Operational Landing Distances are purely advisory and do not have an impact on aircraft certification. However, since the OLDs are a new reference for in-flight landing performance assessment, Airbus has decided to use this reference under all circumstances, including when a system failure has occurred during the flight, which affects approach speed and/or landing distance. This information is subject to approval by the authorities, and the OLD concept will thus find
its way into the AFM in this area. We have taken this opportunity to move it into the digital AFM, thus permitting optimized computations for failure situations, including in case of multiple failures.
4.2. documentation
Section titled “4.2. documentation”Airbus currently publishes the certified Actual Landing Distances (ALDs) in the Quick Reference Handbook (QRH) and the Flight Crew Operating Manual (FCOM). The ALDs serve as a basis for inflight landing distance assessments both without and with in-flight system failures. The shortcomings of this policy were described in depth
The Airbus Safety Magazine
in the previously mentioned article published in Safety First n°10.
The switch to the OLDs for the assessment at time-of-arrival involves a number of changes to the Airbus operational documentation: FCOM, QRH and also FCTM (Flight Crew Training Manual) for background explanation and examples.
Perhaps unexpectedly, these changes also concern the dispatch information, which must be derived by the user from the ALD by applying the appropriate factors. To allow complete removal of the ALD tables, it is thus necessary to switch to a publication of Required Landing Distances (RLD) that are already factored.
A major change in publication practices is the replacement of corrections for variations from reference conditions as increments in meters rather than in percent. This allows a more straightforward computation by the flight crew.
Notably, the RLDs are shown against the usual runway description terms of contaminant type, since this data is certified and must follow existing JAR/EASA regulation. Conversely, the OLDs will be shown against the Reported Braking Action (RBA) terms of Dry, Good, Good to Medium, Medium, Medium to Poor and Poor to allow the full benefit of the matrix used in reporting runway condition.
For each of the RBA, two consecutive tables for both certified landing configurations will show all required information for:
q Manual and automatic landing
q Manual and automatic braking
q Normal and overweight landing. On top of the usual parameters, the new OLD will include accountability for outside temperature and runway slope, in full compliance with the recommendations formulated by the TALPA ARC.
The use of these tables will be associated to a new and simplified flow chart for approach speed determination. This will take into account the appropriate requirements
| Required Landing Distances (m) | |||||
| Weight (1000 kg) | |||||
| 46 | 1170 | 1340 | 1370 | 1360 | 1410 |
| 50 | 1220 | 1400 | 1450 | 1450 | 1500 |
| 54 | 1270 | 1460 | 1540 | 1540 | 1590 |
| 58 | 1330 | 1530 | 1620 | 1630 | 1690 |
| 62 | 1390 | 1600 | 1700 | 1730 | 1820 |
| 66 | 1510 | 1730 | 1780 | 1820 | 1950 |
Figure 2 Required Landing Distances (RLDs) table
|---|---|---|---|---|---|---| |||||||| |Corrections on landing distances (m)||||||| |VAPP|Per 5 kt|+ 90|+ 110|+ 90|+ 100|+ 110| |Wind|Per 5 kt TW|+ 280|+ 320|+ 280|+ 380|+ 440|
Figure 3 RLDs correction table
|---|---|---|---|---|---|---|---|---|---|
| CONF 3 |
|---|
Safety
for autothrust use, ice accretion and wind, including their effect on the landing distance.
The same format will be used for landing distance determination with in-flight failures, thus directly providing a distance for the relevant aircraft condition instead of a correction factor to be applied to the appropriately determined reference distance without failure. This presentation no longer requires pilots to refer to two different sections of the QRH to make this computation, everything is available in one place.
5. FlySmart with Airbus
Section titled “5. FlySmart with Airbus”For all users of the Airbus Electronic Flight Bag solutions, collectively known as FlySmart with Airbus (FSA), the Landing module is being fully redesigned to implement the OLDs for the in-flight computations, while dispatch remains largely unchanged.
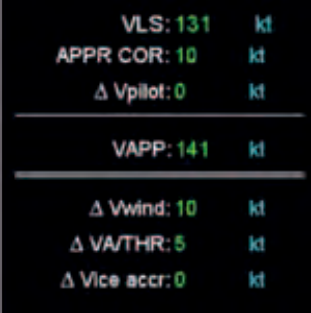
The on-board platform with full optimization capability allows an enhanced implementation when compared with the charts of the QRH. For example, the approach speed can be determined in full compliance with those computed by the Flight Management System (FMS) and displayed on the Primary Flight Display (PFD) to the pilots.
| HYDRAULIC SYSTEM | HYDRAULIC SYSTEM | HYDRAULIC SYSTEM | HYDRAULIC SYSTEM | HYDRAULIC SYSTEM | HYDRAULIC SYSTEM | HYDRAULIC SYSTEM | HYDRAULIC SYSTEM | ||||
|---|---|---|---|---|---|---|---|---|---|---|---|
| DRY | |||||||||||
| GREEn | FULL | - | 1280 | - 10 | + 20 | +90 | +50 | + 100 | + 40 | + 20 | - 40 |
| 3 | 6 | 1350 | - 10 | + 20 | +90 | +60 | + 120 | +50 | +30 | - 40 | |
| BLUE | FULL | - | 1150 | - 10 | +30 | +80 | +50 | + 110 | + 40 | + 20 | - 20 |
| 3 | 6 | 1240 | - 10 | +30 | +90 | +50 | + 130 | +50 | +30 | - 20 | |
| YELLOW | FULL | - | 1180 | - 10 | +30 | +90 | +50 | + 110 | +50 | +30 | - 20 |
| 3 | 6 | 1270 | - 10 | +30 | +90 | +60 | + 120 | +50 | +30 | -30 | |
| 3 | 6 | 1320 | - 10 | + 30 | + 90 | + 50 | + 110 | + 50 | + 40 | - 30 | |
| GOOD | |||||||||||
| GREEn | FULL | - | 1740 | - 10 | +30 | + 130 | + 70 | + 200 | + 70 | +50 | - 100 |
| 3 | 6 | 1920 | - 10 | +30 | + 140 | +80 | + 230 | +90 | +90 | - 110 | |
| BLUE | FULL | - | 1520 | - 10 | +30 | + 110 | +60 | + 180 | + 70 | +50 | -60 |
| 3 | 6 | 1690 | - 10 | +30 | + 120 | + 70 | + 200 | +80 | +60 | - 70 | |
| YELLOW | FULL | - | 1610 | - 20 | +30 | + 120 | + 70 | + 190 | + 70 | +50 | -80 |
| 3 | 6 | 1790 | - 20 | +30 | + 130 | +80 | + 210 | +80 | + 70 | - 100 | |
| 3 | 6 | 1910 | - 10 | + 40 | + 150 | + 80 | + 220 | + 90 | + 80 | - 110 | |
| GOOD to MEDIUM | |||||||||||
| GREEn | FULL | - | 1890 | - 10 | +30 | + 120 | + 70 | + 190 | + 70 | +90 | - 100 |
| 3 | 6 | 2050 | - 10 | +30 | + 120 | +80 | + 190 | +80 | + 100 | - 110 | |
| BLUE | FULL | - | 1770 | - 10 | +30 | +90 | +60 | + 170 | + 70 | + 70 | -80 |
| 3 | 6 | 1940 | - 10 | +30 | + 100 | + 70 | + 180 | +80 | +80 | - 100 | |
| YELLOW | FULL | - | 1870 | - 20 | +30 | + 100 | + 70 | + 180 | + 70 | +80 | - 100 |
| 3 | 6 | 2050 | - 20 | +30 | + 110 | + 70 | + 180 | +80 | +90 | - 120 | |
| 3 | 6 | 2180 | - 10 | + 30 | + 120 | + 80 | + 190 | + 80 | + 110 | - 140 |
Figure 5 In-flight failures correction table
But it is in case of in-flight failures that the capabilities are greatly enhanced by FSA: the computation of the landing performance in these cases will be based on a physical model of the aircraft in the degraded condition. It will be possible to combine them with automatic landing and breaking, overweight landing, and eventually dispatch under Minimum Equipment List (MEL) or Configuration Deviation List (CDL).
Furthermore, FSA provides flexibility to operators to enforce their company policy regarding margins
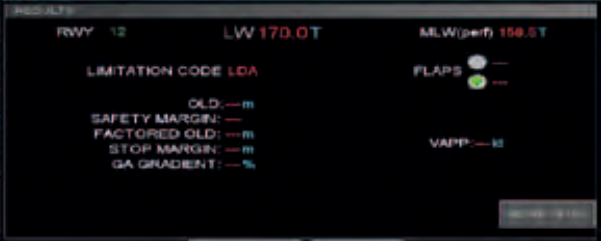
to be taken on landing distances. While the paper charts in the QRH reflect the realistic maximum aircraft performance capability, materialized by the OLD, the Landing module will systematically consider the Factored OLD (FOLD). Only if the available margins are below the company requirements will the computation return a result based on the unfactored OLD, and clearly inform the crew with standard color coding of this reduced margin operation, as illustrated in fig 6,7 and 8.
The Airbus Safety Magazine
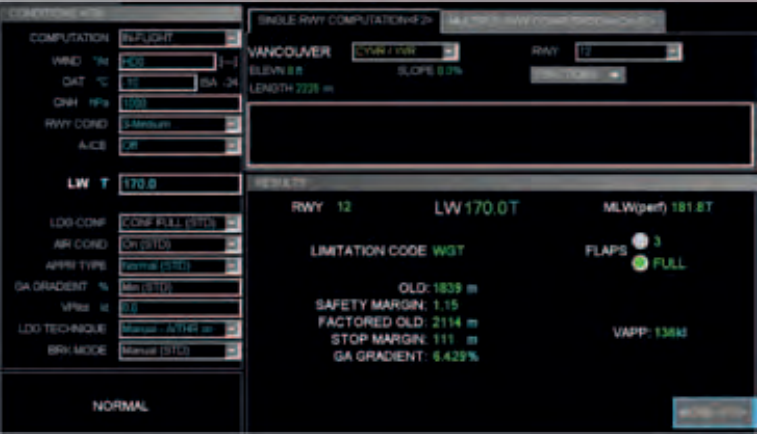
Figure 6 RWY COND: 3-Medium
Runway not limiting, results displayed in green and MLW(perf) limited by FOLD
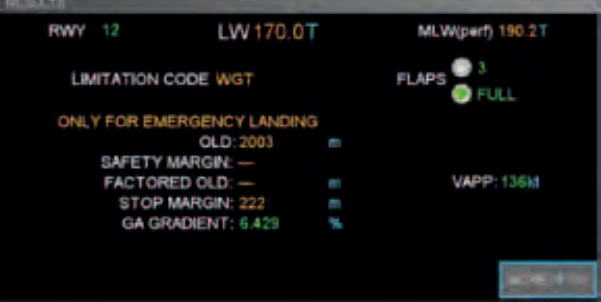
Figure 7
Section titled “Figure 7”RWY COND: 2- Medium to poor
FOLD longer than Landing Distance Available (LDA), but OLD less than LDA, results displayed in amber and MLW(perf) limited by OLD.
6. Status
Section titled “6. Status”Airbus is working to a target date end of September this year for the EFB (Flysmart with Airbus) and the revision of the digital FCOM and QRH:
q The new electronic flight manual (OCTOPUS V28) has received approval from EASA end of April 2011. Aircraft database production has started. This is the basis for all the other work packages, since it provides the capability to actually calculate OLDs.
q For the operational documentation, the new layout of the landing distance tables is finalized. Internal tools for the semi-automatic computation of the tables are under development. Full scale production will start by June.
q The EFB Landing module for L3 standard is undergoing internal validation at this time. Several additional iterations seem likely to allow us to iron out any issues and make it robust for entry into service with the operators.
An update to the Flight Operations Information Letter should be issued beginning of summer, which will include a more detailed view on the final products.
7. Conclusion
Section titled “7. Conclusion”Runway excursion is currently the number one safety risk in terms of occurrences according to ICAO accident statistics.
Let us hope that this risk will be significantly reduced thanks to the combination of:
q The implementation of the OLD concept.
q The introduction of upcoming design features that assist crews in the Go Around decision making process, by providing runway overrun warning (see article on Runway Overrun Prevention System in the eighth Safety First issue, dated July 2009).
Figure 8
RWY COND: 1-POOR
Runway too short even for OLD, no result and MLW(perf) limited by OLD less than actual landing weight shown in red.
来源:Airbus Safety First 网址:https://safetyfirst.airbus.com/airbus-new-operational-landing-distances/ 发布日期:2011-07-14 类别:档案 PDF:原始 PDF
Airbus 安全杂志
Lars KORNSTAEDT
Section titled “Lars KORNSTAEDT”性能专家,飞行业务支援
运营着陆距离(OLD)曾在 2010 年 8 月出版的《Safety First》第十期中刊登的题为“运营着陆距离——飞行中着陆距离评估的新标准”的文章中有所描述。这一新标准是美国联邦航空管理局(FAA)起飞与着陆性能评估航空规则制定小组(TALPA ARC)的成果,被视为行业达成的重要共识。该文章总结认为,空中客车支持 OLD 概念,并将预期通过 FAA 规则制定,在年内向客户提供运营文件与计算工具。
本文阐述了空中客车将从年底开始发布 OLD 的方式。航空公司应开始规划将其纳入运营工作,特别是在信息发布和相关人员培训方面。
2. 主要概念性变更
Section titled “2. 主要概念性变更”TALPA ARC 向 FAA 提出的规则制定建议是一个紧密集成的综合方案,包含三套监管建议:
- 针对机场:关于跑道状况评估与报告机制的建议;
- 针对飞机制造商:关于发布飞行中着陆性能评估数据的建议;
- 针对运营人:关于到达时刻评估的建议。
空中客车正在着手调整其地面和机上性能计算工具,以及运营文件,以符合提案中确立的原则。同时也将向客户提供最佳实践建议,指导如何利用这些信息并充分发挥该概念的优势。
然而,OLD 概念的监管框架尚未到位,即使在 FAA 规则下也如此。其主要后果是,OLD 的使用必须适应跑道状况报告实践不一定符合相关建议的环境。
另一个方面是,在某些条件下,新的飞行中性能评估可能比现行适用的签派要求更为严格。在 JAR/EASA 规则下尤其如此。因此,一架根据当前已折减的可用着陆距离(ALD)要求签派的飞机,一旦离地后,可能按照 OLD 变得不再适用。
航空公司将需要制定相应的政策和培训,使机组人员能够弥补这些不足,直至 FAA、ICAO 和 EASA 启动的规则制定进程完成。
3. 矩阵表
Section titled “3. 矩阵表”跑道状况评估表是 OLD 概念的基石。它提供了一种机制,用于减轻基于污染物类型和深度进行性能计算时存在的多种实际风险。这些风险包括:
- 机组人员忽视或错误解读未在性能计算选项中涵盖的跑道污染物报告,如霜/冰晶或湿滑条件;
- 机组人员忽视或错误解读已报告的估计摩擦系数或刹车效果(飞行员报告);
- 污染物在冰点附近的相态变化;
- 分层污染物;
- 主动降水条件下状况的快速变化。
TALPA ARC 的跑道状况报告流程旨在尽可能覆盖各种可能条件,并通过考虑所有可用信息向机组人员提供安全报告。但这并不意味着对前机飞行员的主观评估或持续摩擦力测量给予准确性认可——这些测量与飞机性能之间缺乏相关性这一问题已在多年间被广泛讨论。然而,当此类信息可用时,其提供的指标应被用于下调基于污染物类型和深度所作出的主要评估。
安全
4.1. 审定飞机飞行手册(AFM)
Section titled “4.1. 审定飞机飞行手册(AFM)”运营着陆距离纯属咨询性质,不会对飞机取证产生影响。然而,由于运营着陆距离是飞行中着陆性能评估的新参考,空客决定在所有情况下使用此参考,包括在飞行期间发生影响进近速度或着陆距离的系统故障时。此信息需经当局批准,因此运营着陆距离概念将以此方式纳入飞行手册。我们借此机会将其移入数字飞行手册,从而允许对故障情况进行优化计算,包括多故障情况。
4.2. 文件
Section titled “4.2. 文件”空客目前在快速参考手册(QRH)和飞行机组操作手册(FCOM)中发布审定的实际着陆距离(ALD)。实际着陆距离既是飞行中着陆距离评估(无论是否存在飞行中系统故障)的基础。此政策的不足之处已在上述发表在《Safety First》第10期中的文章中详细阐述。
向运营着陆距离的转变涉及空客运营文档的多项变更:FCOM、QRH以及飞行机组训练手册(FCTM)中的背景说明和示例。
或许出乎意料的是,这些变更还涉及放行信息,用户需通过将适当系数应用于实际着陆距离来推导放行信息。为了能够完全移除实际着陆距离表,有必要改用已含系数的所需着陆距离(RLD)的发布方式。
出版物实践的一项重大变更是以米为单位的增量形式替代对参考条件偏差的修正,而不是百分比。这允许飞行机组进行更直接的计算。
值得注意的是,所需着陆距离是依据跑道状况描述的污染物类型给出的,因为这些数据已经过审定,必须遵循现行的JAR/EASA规章。相反,运营着陆距离将依据报告刹车效果(RBA)术语——干跑道、良好、良好至中等、中等、中等至差、差——以充分受益于报告跑道状况所使用的矩阵。
对于每一种报告刹车效果,两张连续表格将涵盖两种审定着陆构型,显示所有所需信息:
- 手动和自动着陆
- 手动和自动刹车
- 正常和超重着陆。除常规参数外,新运营着陆距离将包括对外界温度和跑道坡度的责任认定,完全符合TALPA ARC提出的建议。
这些表格的使用将与进近速度确定的新简化流程图相结合。这将考虑自动推力的适当使用要求、冰积聚和风的相应要求,包括其对着陆距离的影响。
相同格式将用于飞行中故障情况下的着陆距离确定,从而直接提供相关飞机状况下的距离,而不是需要应用到适当确定的基准距离(无故障)上的修正系数。此呈现方式不再要求飞行员参阅QRH的两个不同部分来完成此计算,所有内容均在一处可查。
|---|---|---|---|---|---| |所需着陆距离(m)|||||| |重量(1000 kg)|||||| |46|1170|1340|1370|1360|1410| |50|1220|1400|1450|1450|1500| |54|1270|1460|1540|1540|1590| |58|1330|1530|1620|1630|1690| |62|1390|1600|1700|1730|1820| |66|1510|1730|1780|1820|1950|
图2 所需着陆距离(RLD)表
|---|---|---|---|---|---|---| |着陆距离修正(m)||||||| |VAPP|每5 kt|+ 90|+ 110|+ 90|+ 100|+ 110| |风|每5 kt顺风|+ 280|+ 320|+ 280|+ 380|+ 440|
图3 所需着陆距离修正表
|---|---|---|---|---|---|---|---|---|---|
| CONF 3 |
|---|
5. FlySmart with Airbus
Section titled “5. FlySmart with Airbus”对于所有空客电子飞行包(EFB)解决方案(统称为FlySmart with Airbus,FSA)的用户,着陆模块正在被全面重新设计,以在飞行中计算中实施OLD,而签派部分基本保持不变。
机载平台具有完整的优化能力,与QRH图表相比可实现增强的实施。例如,进近速度可完全符合飞行管理系统(FMS)的计算结果,并显示在主飞行显示器(PFD)上供飞行员查看。
| 液压系统 | 液压系统 | 液压系统 | 液压系统 | 液压系统 | 液压系统 | 液压系统 | 液压系统 | ||||
|---|---|---|---|---|---|---|---|---|---|---|---|
| 干 | |||||||||||
| GREEn | FULL | - | 1280 | - 10 | + 20 | +90 | +50 | + 100 | + 40 | + 20 | - 40 |
| 3 | 6 | 1350 | - 10 | + 20 | +90 | +60 | + 120 | +50 | +30 | - 40 | |
| BLUE | FULL | - | 1150 | - 10 | +30 | +80 | +50 | + 110 | + 40 | + 20 | - 20 |
| 3 | 6 | 1240 | - 10 | +30 | +90 | +50 | + 130 | +50 | +30 | - 20 | |
| YELLOW | FULL | - | 1180 | - 10 | +30 | +90 | +50 | + 110 | +50 | +30 | - 20 |
| 3 | 6 | 1270 | - 10 | +30 | +90 | +60 | + 120 | +50 | +30 | -30 | |
| 3 | 6 | 1320 | - 10 | + 30 | + 90 | + 50 | + 110 | + 50 | + 40 | - 30 | |
| 好 | |||||||||||
| GREEn | FULL | - | 1740 | - 10 | +30 | + 130 | + 70 | + 200 | + 70 | +50 | - 100 |
| 3 | 6 | 1920 | - 10 | +30 | + 140 | +80 | + 230 | +90 | +90 | - 110 | |
| BLUE | FULL | - | 1520 | - 10 | +30 | + 110 | +60 | + 180 | + 70 | +50 | -60 |
| 3 | 6 | 1690 | - 10 | +30 | + 120 | + 70 | + 200 | +80 | +60 | - 70 | |
| YELLOW | FULL | - | 1610 | - 20 | +30 | + 120 | + 70 | + 190 | + 70 | +50 | -80 |
| 3 | 6 | 1790 | - 20 | +30 | + 130 | +80 | + 210 | +80 | + 70 | - 100 | |
| 3 | 6 | 1910 | - 10 | + 40 | + 150 | + 80 | + 220 | + 90 | + 80 | - 110 | |
| 好至中 | |||||||||||
| GREEn | FULL | - | 1890 | - 10 | +30 | + 120 | + 70 | + 190 | + 70 | +90 | - 100 |
| 3 | 6 | 2050 | - 10 | +30 | + 120 | +80 | + 190 | +80 | + 100 | - 110 | |
| BLUE | FULL | - | 1770 | - 10 | +30 | +90 | +60 | + 170 | + 70 | + 70 | -80 |
| 3 | 6 | 1940 | - 10 | +30 | + 100 | + 70 | + 180 | +80 | +80 | - 100 | |
| YELLOW | FULL | - | 1870 | - 20 | +30 | + 100 | + 70 | + 180 | + 70 | +80 | - 100 |
| 3 | 6 | 2050 | - 20 | +30 | + 110 | + 70 | + 180 | +80 | +90 | - 120 | |
| 3 | 6 | 2180 | - 10 | + 30 | + 120 | + 80 | + 190 | + 80 | + 110 | - 140 |
图5 飞行中故障修正表
但在飞行中故障情况下,FSA的能力得到了极大的增强:这些情况下着陆性能的計算将基于飞机在降级状态下的物理模型。它将能够与自动着陆和制动、超重着陆以及最低设备清单(MEL)或构型缺损清单(CDL)条件下的签派相结合。
此外,FSA为运营商提供了灵活性,以执行其公司关于着陆距离裕度的政策。QRH中的纸质图表反映了由OLD体现的飞机真实最大性能能力,而着陆模块将系统性地考虑因数化OLD(FOLD)。只有当可用裕度低于公司要求时,计算才会返回基于未因数化OLD的结果,并使用标准颜色编码明确告知机组人员这种裕度缩减的运行情况,如图6、7和8所示。
Airbus Safety Magazine
图6 RWY COND:3-中等
跑道不限制,结果显示为绿色,MLW(perf)受FOLD限制
RWY COND:2-中等至差
FOLD大于可用着陆距离(LDA),但OLD小于LDA,结果显示为琥珀色,MLW(perf)受OLD限制。
空客正在朝着今年9月底的目标日期推进EFB(FlySmart with Airbus)和数字FCOM及QRH的修订:
q 新版电子飞行手册(OCTOPUS V28)已于2011年4月底获得EASA批准。飞机数据库生产已经开始。这是所有其他工作包的基础,因为它提供了实际计算OLD的能力。
q 对于运行文档,着陆距离表的新布局已经最终确定。用于半自动计算表格的内部工具正在开发中。全面生产将于6月开始。
q 用于L3标准的EFB着陆模块目前正在进行内部验证。可能需要进行多次迭代,以使我们能够消除任何问题,并使其能够稳健地投入运营商使用。
飞行运行信息函的更新将在夏初发布,其中将包括对最终产品的更详细说明。
根据ICAO事故统计数据,跑道偏离是目前排名第一的安全风险。
让我们希望这一风险将因以下组合而显著降低:
q OLD概念的实施。
q 即将推出的设计特性的引入,通过提供跑道冲程警告来辅助机组人员进行复飞决策(参见2009年7月出版的第八期Safety First中关于跑道冲程预防系统的文章)。
图8
RWY COND:1-差
即使对于OLD来说跑道也太短,无结果显示MLW(perf)受实际着陆重量下的OLD限制,显示为红色。