Flight Data Analysis (FDA), a Predictive Tool for Safety Management System (SMS)
Source: Airbus Safety First URL: https://safetyfirst.airbus.com/flight-data-analysis-fda-a-predictive-tool-for-safety-management-system-sms/ Published: 2014-01-29 Magazine Issue: 2014-01 Category: Flight Ops, ACMS, analysis, DAR, data, DFDR, FDA, FDM, FDR, flight, FOQA, QAR, recorder, risk,, SMS PDF: Original PDF
Joel DELHOM Manager, Airline Safety Management Flight Operations & Training Support
Introduction
Section titled “Introduction”A Flight Data Analysis (FDA) program, also known as Flight Data Monitoring (FDM) or Flight Operation Quality Assurance (FOQA) is designed to enhance Flight Safety by:
– Identifying an airline’s opera-
Section titled “– Identifying an airline’s opera-”tional safety risks
Section titled “tional safety risks”FDA is based on the routine analysis of data recorded during revenue flights. These data are compared against pre-defined envelopes and values, to check whether the aircraft has been flown outside the scope of the standard operating procedures (safety events).
– Taking the necessary actions to reduce these risks
Section titled “– Taking the necessary actions to reduce these risks”When a safety event is highlighted by the program, statistical analysis will assess whether it is isolated or part of a trend. Appropriate action is then taken in order to take corrective actions if needed.
This article briefly describes the recorders evolution, which allowed evolving from a reactive to a predictive hazard identification methodology. Each step of an FDA program will then be detailed and for each step, best practices will be highlighted.
History of Recorders
Section titled “History of Recorders”During World War II the US National Advisory Committee for Aeronautics (NACA) installed recorders in fighters, bombers and transport aircraft to collect indicated airspeed and load factor data in order to improve structural design.
Figure 1 First generation, metal foil recorder
Later in the sixties, regulatory authorities mandated the fitting of Flight Data Recorders (FDR) into large commercial aircraft for accident investigation. The first FDRs (fig.1) could only engrave 5 parameters onto a non-reusable metal foil: heading, altitude, airspeed, vertical acceleration and time.
Figure 2 Second generation, tape recorder
Recorders technology then improved significantly - from analogue to digital on tape (fig.2), then to solid state (fig.3) able to record over 3,000 parameters. In the meantime, Flight Data Monitoring processes were encouraged and sometime requested by authorities.
Figure 3 Third generation, solid state recorder
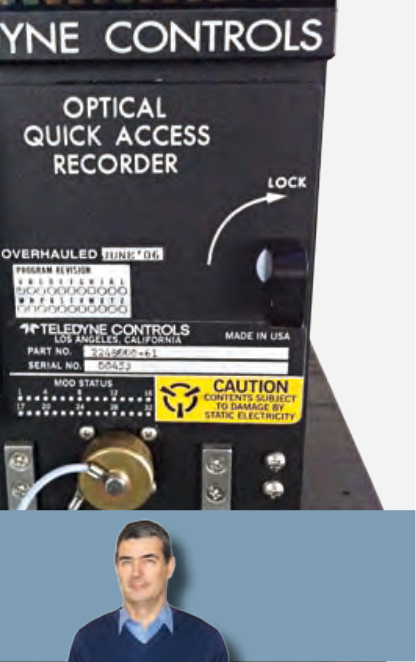
Today, while Flight Data Recorders (FDR) or Digital Flight Data Recorders (DFDR) are dedicated to accident investigation (fig.4), Flight Data Analysis programs extract data from easily accessible Quick Access Recorders (QAR) or Digital ACMS* Recorders (DAR). QARs are exact copies of the DFDRs while DARs allow to customize the recorded parameters.
Figure 4 Flight Data Recorders (FDR)
*Aircraft Condition Monitoring System
Hazard Identification Methodologies
Section titled “Hazard Identification Methodologies”The ICAO SMS Manual defines three methodologies for identifying hazards: – Reactive - Through analysis of past incidents or accidents Hazards are identified through investigation of safety occurrences. Incidents and accidents are potential indicators of systems’ deficiencies and therefore can be used to determine the hazards that were both contributing to the event or are latent. – Proactive - Through analysis of the airline’s activities
The goal is to identify hazards before they materialize into incidents or accidents and to take the necessary actions to reduce the associated safety risks. A proactive process is based upon the notion that safety events can be minimized by identifying safety risks within the system before it fails, and taking the necessary actions to mitigate such safety risks.
– Predictive - Through data gathering in order to identify possible negative future outcomes or events.
The predictive process captures system performance as it happens in normal operations to identify potential future problems. This requires continuous capturing of routine operational data in real time. Predictive processes are best accomplished by trying to find trouble, not just waiting for it to show up. Therefore, predictive process strongly searches for safety information that may be i ndicative of emerging safety risks from a va- riety of sources.
As illustrated in the history paragraph above, FDR logically led to FDA and the reactive process evolved into a predictive process. The main asset of an efficient FDA is to be able to jump directly to the predictive process without passing through the incident or accident reactive process case. In other words, FDA prediction process aims at avoiding material and/or human costs by being ahead of any safety precursors before an incident or accident occurs..
FDA: the full Method and its best Practices
Section titled “FDA: the full Method and its best Practices”Flight Data Recording R
Flight Data Downloading R
Flight Data Recording
Section titled “Flight Data Recording”Flight Data Downloading
Section titled “Flight Data Downloading”Information coming from aircraft sensors, onboard computers and other instruments is recorded into the dedicated FDA recorder (QAR, DAR …). These Data are recorded as binary raw data files which are sequenced in frames and subframes. Each subframe is divided into a number of “words”, each one with a fixed number of bits. A parameter is recorded on one or several bits of one or more words. To save memory space, a parameter value is generally not recorded as such, but converted using a conversion function defined by the aircraft manufacturer.
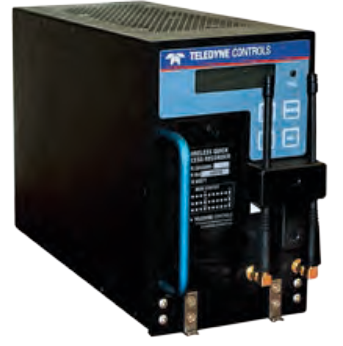
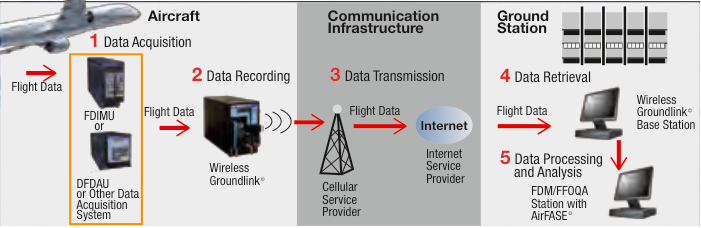
When the aircraft arrives at the gate, data are either extracted by maintenance staff via optical disc or Personal Computer Memory Card International Association (PCMCIA) card, or automatically via a wireless link (fig.5 & 6).
BEST PRACTICE
Section titled “BEST PRACTICE”High ratio of monitored flights
Section titled “High ratio of monitored flights”• Flights should be monitored as much as possible to make the analysis as valuable as possible, 90% should be a minimum.
Calibrated data
Section titled “Calibrated data”Figure 5 • Depending of what data is available Wireless ground link box and what needs to be monitored, the choice of recorded parameters must BEST PRACTICE be carried out carefully.
Recovering reliability
Section titled “Recovering reliability”• These selected parameters should be recorded at the optimum frequency depending on the parameter sensitivity (sampling rate).
• The maintenance data recovery process should be secured through a useful and understood process.
Recommended automated wireless downloading
Section titled “Recommended automated wireless downloading”Recorders reliability
Section titled “Recorders reliability”• It guarantees a high rate of downloaded flights by avoiding overloaded memories and thus partial loss of flight data.
• A solid maintenance process must be implemented to maintain the recorders at a high level of efficiency through regular testing and calibrating.
Flight Data Analysis
Section titled “Flight Data Analysis”Safety Risk Management, Flight Data Communication Analysis and Improvement** R R **Monitoring
Section titled “Safety Risk Management, Flight Data Communication Analysis and Improvement** R R **Monitoring”Flight Data Processing
Flight Data Processing
Section titled “Flight Data Processing”BEST PRACTICE
Section titled “BEST PRACTICE”To transcribe the recorded parameters into exploitable values, raw data must be processed in order to recover the actual values (fig.7 & 8). An automatic filtering helps rejecting corrupted data. Some values must be derived from processed parameters because not recorded as such.
Good data resolution
Section titled “Good data resolution”• Selected data must be reliable and pertinent, they should benefit from a large number of measuring points (for example, to be able to trace the exact touch down point at landing, the vertical acceleration must be recorded at a high frequency ratio).
Events are automatically weighted according to risk (low, medium or high) with fine tuned algorithms. Several events can be associated to unveil an undesirable situation ( for example: path high in approach at 1,200 feet + path high in approach at 800 feet + path high in approach at 400 feet = continuously high path during final).
• The decoding program, used for actual exploitable values recovery, must be refined and validated by expert pilots for operational legibility.
Calibrated and validated event definition
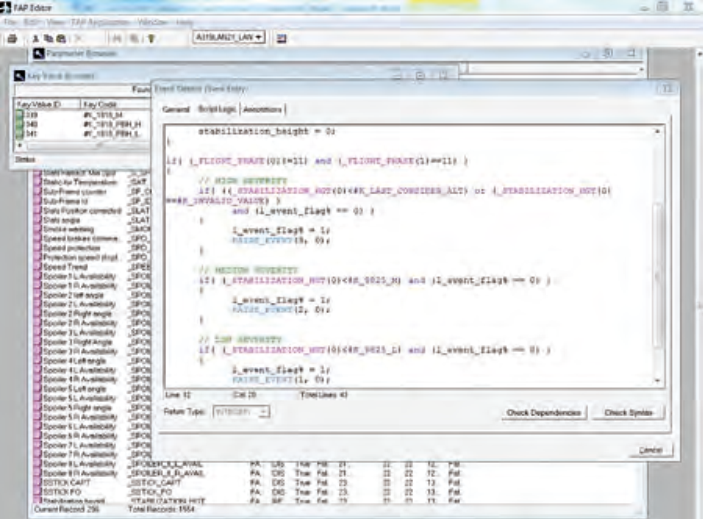
Section titled “Calibrated and validated event definition”• The event development and algorithms of computation need to be simple and operationally meaningful.
• Their detection thresholds need to be calibrated and verified by using various means like simulators, cross comparison and/or flights.
Figure 7 Example of Hexadecimal uncompressed raw data
Figure 8
Example of event algorithm in development environment
Analysts manually filter the developed flights to reject the inconsistent ones and therefore guarantee the robustness of the data base.
They look for all high deviation magnitude events in order to assess any serious safety concern and take appropriate corrective action (fig.9 to 15).
Correlation with all other means like mandatory or voluntary reports for example, will multiply the analysis efficiency.
All reliable events are stored into the database and are investigated on a regular basis to highlight any trend that could show a latent or potential risk.
BEST PRACTICE
Section titled “BEST PRACTICE”Appropriate analysis
Section titled “Appropriate analysis”• A filtering is necessary, it is usually difficult and time consuming (for example all non-revenue flights like training flights must be removed from the analysis data base in order not to induce wrong statistical figures – training flights more frequently generate some particular types of events).
• A single flight with high deviation level must be analyzed following the steps of the proactive process.
-
To understand and interpret the
-
results properly, pilots who are conversant with flight data analysis and proficient on the aircraft type must be involved for their operational expertise.
-
Statistics on a large number of
-
flights must be done on a regular basis following the steps of the predictive process.
Competent Flight Data Analysis team members
Section titled “Competent Flight Data Analysis team members”• FDA team members should have an in-depth knowledge of SOPs, aircraft handling characteristics, aerodromes and routes to place the FDA data in a credible context
-
All FDA team members need
-
appropriate training or experience for their respective area of data analysis

Figure 9 Example of an FDA tool: AirFASE
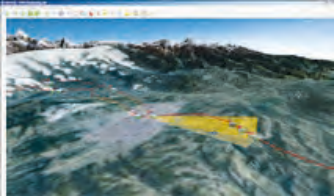
Figure 12 Example of RNP-AR arrival visualization
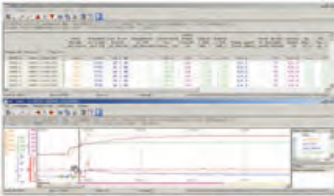
Figure 15 Example of list and trace
Safety Risk Management, Communication and Improvement Monitoring
Section titled “Safety Risk Management, Communication and Improvement Monitoring”The process starts with the identification of hazards and their potential consequences. The safety risks are then assessed against the threat of potential damage related to the hazard. These risks are weighted in terms of probability and severity (fig.16 & 17). If the assessed safety risks are deemed not to be tolerable, appropriate corrective action is taken.
When an issue emerges, when a mitigation action has been decided by competent people, it must be communicated to the whole air operation community to share all related safety information. Knowledge is a good protection against any potential risk.
On the other hand an adequate monitoring process must be started to validate the efficiency of the mitigation action. This aims to guarantee the effective closing of the loop.
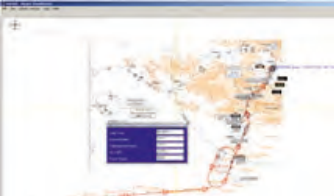
Figure 10 Example of airport visualization
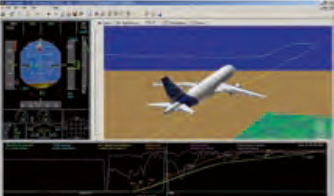
Figure 13 Example of flight replay
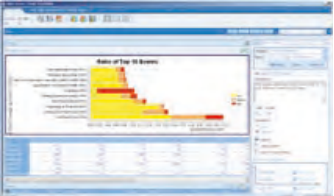
Figure 16 Example of statistical analysis
BEST PRACTICE
Section titled “BEST PRACTICE”Competent safety risk assessment team members
Section titled “Competent safety risk assessment team members”• The people in charge of assessing the safety risks must have a good knowledge and background on flight operations and must have been especially trained to perform an efficient risk assessment.
Feedback to operations
Section titled “Feedback to operations”• Mankind survived and developed principally due to its ability to communicate and share any risk knowledge. It is still valid in the aviation environment and information on any safety concern must be widely spread out.
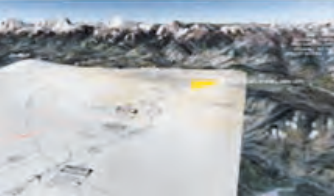
Figure 11 Example of arrival chart visualization
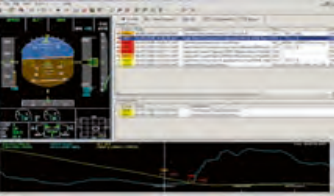
Figure 14 Example of flight replay
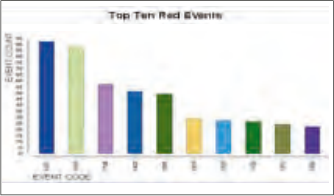
Figure 17 Example of statistical analysis
Conclusion
Section titled “Conclusion”As part of an airline Safety Management System, Flight Data Analysis is a very powerful tool. This is true if used properly, which implies that All FDA team members are trained and competent in their area of analysis and risk assessment.
Amongst others practices it should be demonstrated that:
-
The recorders health are monitored,
-
High ratios of flights are recorded and analyzed,
-
The analysis data base is filtered,
-
Pilot expertise is used for to validate the decoding process and understand the fine analysis.
Finally, proper analysis / identification of right priorities / definition of mitigating actions and their associated action plan are the essential elements to obtain the maximum benefit from Flight Data Analysis tools and processes.
飞行数据分析(FDA),安全管理体系(SMS)的预测工具
来源: Airbus Safety First 网址: https://safetyfirst.airbus.com/flight-data-analysis-fda-a-predictive-tool-for-safety-management-system-sms/ 发布日期: 2014-01-29 杂志期号: 2014-01 分类: Flight Ops, ACMS, analysis, DAR, data, DFDR, FDA, FDM, FDR, flight, FOQA, QAR, recorder, risk,, SMS PDF: Original PDF
Joel DELHOM 航空公司安全管理经理 飞行运营与培训支持
飞行数据分析(FDA)项目,又称飞行数据监控(FDM)或飞行运营质量保证(FOQA),旨在通过以下方式提升飞行安全:
– 识别航空公司的运营安全风险
Section titled “– 识别航空公司的运营安全风险”FDA 基于对商业飞行中记录数据的常规分析。这些数据与预先设定的包线和数值进行比对,以检查飞机是否在标准操作程序范围之外飞行(安全事件)。
– 采取必要措施降低这些风险
Section titled “– 采取必要措施降低这些风险”当项目标记出安全事件后,统计分析将评估该事件是孤立的还是属于某种趋势。如有需要,将采取适当的纠正措施。
本文简要介绍记录器的演变历程,该演变使得危险识别方法从被动式发展为预测式。本文将详细阐述FDA项目的每个步骤,并对每个步骤的最佳实践进行重点说明。
记录器发展史
Section titled “记录器发展史”二战期间,美国国家航空咨询委员会(NACA)在战斗机、轰炸机和运输机上安装了记录器,以收集指示空速和载荷因子数据,用于改进结构设计。
图1 第一代,金属箔记录器
20世纪60年代后期,监管当局强制要求在大型商用飞机上安装飞行数据记录器(FDR)用于事故调查。第一代FDR(图1)只能在不可重复使用的金属箔上刻录5个参数:航向、高度、空速、垂直加速度和时间。
图2 第二代,磁带记录器
记录器技术随后显著改进——从模拟式发展到磁带数字式(图2),再到能够记录超过3000个参数的固态式(图3)。与此同时,飞行数据监控流程也得到了鼓励推广,部分情况下监管当局还提出了相关要求。
图3 第三代,固态记录器
如今,飞行数据记录器(FDR)或数字飞行数据记录器(DFDR)专用于事故调查(图4),而飞行数据分析项目则从易于访问的快速访问记录器(QAR)或数字ACMS*记录器(DAR)中提取数据。QAR是DFDR的精确副本,而DAR允许自定义记录的参数。
图4 飞行数据记录器(FDR)
*飞机状态监控系统
危险识别方法
Section titled “危险识别方法”ICAO《安全管理体系手册》定义了三种危险识别方法:
– 被动式(Reactive) - 通过分析过去的事故征候或事故
通过安全事件的调查来识别危险。事故征候和事故是系统缺陷的潜在指标,因此可用于确定导致事件发生和潜在存在的危险。
– 主动式(Proactive) - 通过分析航空公司活动
目标是在危险演变为事故征候或事故之前将其识别出来,并采取必要措施降低相关安全风险。主动式流程基于这样一种理念:通过在系统发生故障之前识别系统内的安全风险,并采取必要措施减轻此类安全风险,可以最大限度地减少安全事件。
– 预测式(Predictive) - 通过数据收集识别可能的负面未来结果或事件
预测式流程在正常运行中实时捕获系统性能,以识别潜在的未来的问题。这需要对常规运营数据进行持续实时捕获。预测式流程的最佳实现方式是主动寻找问题,而非等待问题出现。因此,预测式流程积极地从多种来源搜寻可能表明新出现安全风险的安全信息。
如上文历史段落所述,FDR 自然而然地推动了 FDA 的发展,被动式流程演进为预测式流程。高效 FDA 的主要优势在于能够直接进入预测式流程,而无需经历事故征候或事故的被动式调查过程。换言之,FDA 预测流程的目标是通过在任何安全先兆演变为事故征候或事故之前抢先一步,避免财产和/或人员损失。
FDA:完整方法及最佳实践
Section titled “FDA:完整方法及最佳实践”飞行数据记录 R
飞行数据下载 R
飞行数据记录
Section titled “飞行数据记录”飞行数据下载
Section titled “飞行数据下载”来自飞机传感器、机载计算机和其他仪器的信息被记录到专用的FDA记录器(QAR、DAR……)中。这些数据被记录为二进制原始数据文件,以帧和子帧的形式排列。每个子帧被划分为若干”字”,每个字具有固定位数。参数被记录在一个或多个字的一位或多位上。为了节省存储空间,参数值通常不以原始形式记录,而是使用制造商定义的转换函数进行转换。
当飞机停靠廊桥时,数据由维护人员通过光盘或个人计算机内存卡国际协会(PCMCIA)卡提取,或通过无线链路自动下载(图5和图6)。
高比例监控飞行
Section titled “高比例监控飞行”• 应尽可能多地对航班进行监控,以使分析发挥最大价值,90%应为最低标准。
图5 • 根据可用数据_无线地面链路装置_和监控需求,记录参数的选择必须最佳实践谨慎进行。
• 这些选定参数应根据参数敏感度(采样率)以最佳频率记录。
• 维护数据恢复过程应通过一个有用且易于理解的过程来保障。
推荐自动无线下载
Section titled “推荐自动无线下载”记录器可靠性
Section titled “记录器可靠性”• 它通过避免内存过载(从而导致部分飞行数据丢失)来保证高下载率。
• 必须实施可靠的维护流程,通过定期测试和校准保持记录器的高效运行。
飞行数据分析
Section titled “飞行数据分析”安全风险管理、飞行数据通信分析及改进** R R **监控
Section titled “安全风险管理、飞行数据通信分析及改进** R R **监控”飞行数据处理
Section titled “飞行数据处理”为了将记录的参数转录为可用值,必须处理原始数据以恢复实际值(图7和图8)。自动过滤有助于剔除损坏的数据。某些值必须从已处理的参数中推导出来,因为它们并非直接记录。
事件根据风险(低、中或高)自动加权,并使用微调算法。多个事件可以关联起来揭示不良情况(例如:进近1200英尺高度偏高 + 进近800英尺高度偏高 + 进近400英尺高度偏高 = 最后进近期间持续偏高)。
良好的数据分辨率
Section titled “良好的数据分辨率”• 选定数据必须可靠且相关,应受益于大量测量点(例如,为了能够追踪着陆时的精确接地位置,垂直加速度必须以高频率记录)。
• 用于恢复实际可用值的解码程序必须由资深飞行员完善和验证,以确保操作可读性。
经过校准和验证的事件定义
Section titled “经过校准和验证的事件定义”• 事件开发和计算算法需要简单且具有操作意义。
• 其检测阈值需要通过模拟器、交叉比较和/或飞行等多种方式进行校准和验证。
图7 十六进制未压缩原始数据示例
图8
开发环境中的事件算法示例
分析人员手动过滤已处理的航班数据,剔除不一致的数据,从而保证数据库的稳健性。
他们寻找所有高偏差幅度事件,以评估任何严重的安全问题并采取适当的纠正措施(图9至图15)。
与其他手段(如强制性或自愿报告)进行关联将提高分析效率。
所有可靠事件都存储在数据库中,并定期进行调查,以突出显示可能表明潜在或未来风险的任何趋势。
• 需要进行筛选,这通常困难且耗时(例如,所有非收入航班(如训练飞行)必须从分析数据库中移除,以避免产生错误的统计数据——训练飞行更频繁地产生某些特定类型的事件)。
• 偏离等级较高的单个飞行必须按照主动过程的分析步骤进行分析。
-
为了正确理解和解释
-
结果,必须让熟悉飞行数据分析并精通该机型操作的飞行员参与,以提供其运行专业知识。
-
必须定期对大量
-
飞行进行统计,按照预测过程的分析步骤进行分析。
合格的飞行数据分析团队成员
Section titled “合格的飞行数据分析团队成员”• FDA团队成员应深入了解标准操作程序(SOP)、飞机操纵特性、机场和航线,以便将FDA数据置于可信的背景下
-
所有FDA团队成员需要
-
在各自的数据分析领域接受适当的培训或具备相关经验
Figure 9 FDA工具示例:AirFASE
Figure 12 RNP-AR进近可视化示例
Figure 15 列表与轨迹示例
安全风险管理、沟通与改进监控
Section titled “安全风险管理、沟通与改进监控”该过程从识别危险源及其潜在后果开始。然后根据与危险源相关的潜在损害威胁评估安全风险。这些风险按概率和严重程度进行加权(图16和17)。如果评估的安全风险被认为不可容忍,则采取适当的纠正措施。
当问题出现时,当负责人员决定采取缓解措施后,必须向整个航空运营界传达,以便共享所有相关的安全信息。知识是对任何潜在风险的有力防护。
另一方面,必须启动适当的监控过程,以验证缓解措施的有效性。这旨在确保闭环的有效关闭。
Figure 10 机场可视化示例
Figure 13 飞行回放示例
Figure 16 统计分析示例
合格的安全风险评估团队成员
Section titled “合格的安全风险评估团队成员”• 负责评估安全风险的人员必须具备良好的飞行运营知识和背景,并接受过专门培训以进行有效的风险评估。
• 人类生存和发展主要归功于其沟通和分享风险知识的能力。这在航空环境中仍然适用,任何安全问题的信息必须广泛传播。
Figure 11 进近图可视化示例
Figure 14 飞行回放示例
Figure 17 统计分析示例
作为航空公司安全管理系统的组成部分,飞行数据分析是一个非常有用的工具。这在正确使用的情况下是成立的,这意味着所有FDA团队成员都必须在各自的分析和风险评估领域接受培训并具备能力。
除其他做法外,应证明:
-
监控记录器的健康状态,
-
记录和分析的飞行比例较高,
-
分析数据库经过筛选,
-
利用飞行员专业知识来验证解码过程并理解精细分析。
最后,正确的分析 / 确定正确的优先级 / 定义缓解措施及其相关的行动计划,是从飞行数据分析工具和过程中获得最大收益的基本要素。